The Quarterly Checkup: Q1 2026 Market & VC Landscape
Published on June 3, 2026 · Written by Jason Robertson
Market Overview
(In which a Middle East war, the largest single quarter of venture deployment ever recorded, and the most underwhelming quarter for the public markets that were supposed to validate it, all arrived inside the same ninety days.)
Q1 2026 produced two records and one war, and the relationship between them is the entire story. U.S. venture capital deployment reached USD $267 billion in the quarter, the largest ever recorded. U.S. venture exit value reached USD $347 billion, also a record. At the same time, the S&P 500 fell 4.6% and a new shooting conflict (war) between the United States and Iran rewrote the energy and inflation picture in late February. The headline records came almost entirely from a handful of artificial intelligence (AI) companies. The public market weakness was almost entirely about whether those same companies are worth what the private market thinks they are. Both observations are accurate at the same time, and that simultaneity is the discomfort of the quarter.
A reader of last quarter’s report may recall that I framed the end of 2025 as the question of whether we were at the end of the long dark tunnel of the challenging post-COVID VC environment. Q1 2026’s answer was unhelpful: we are out of the tunnel, but the road on the other side is not the road we expected. Liquidity exists; it is concentrated. Fundraising exists; it is concentrated. The exit market exists; it is concentrated. The recovery is happening, it is just narrower than anyone hoped it would be.
The macro backdrop did not break, but it did bind: real GDP grew at 1.6% annualized on the Bureau of Economic Analysis’ (BEA) second estimate, inflation moved back into focus after a March CPI print of +0.9% month over month and +3.3% year over year tied largely to an Iran-driven energy shock, and the Federal Reserve held the federal funds target at 3.50% to 3.75% with markets pricing in zero further cuts for the year by quarter end. The cost of capital is no longer falling, which matters more for venture than for almost any other corner of the economy.
This sets up the central tension of the report. The market is open; it is open most widely for companies and managers who were already at the top of it. For everyone else, Q1 was a quarter of patience, discipline, and waiting to see whether the post-Iran IPO window reopens cleanly and whether the wave of consumer AI launches consolidates against digital health or creates new partnership rails. We will know more soon.
U.S. Macroeconomic Landscape
The U.S. economy in Q1 2026 did not break. It did not accelerate either. It expanded at a moderate rate, watched its inflation pick back up under an energy shock that nobody had pencilled into Q1 forecasts, and put a central bank on hold in a quarter where it had been expected to keep cutting. None of that, by itself, is dramatic. The interaction between the three of them is the discomfort.
Real GDP grew at 1.6% annualized in Q1 on the BEA’s second estimate (released May 28, 2026), revised down from the +2.0% advance estimate and up from a revised +0.7% in Q4 2025. The Q4 figure was distorted by the longest government shutdown in modern history and the cancellation of the BEA’s advance Q3 GDP release, with the BEA estimating the reduction in federal services subtracted roughly one percentage point from Q4 GDP, putting underlying Q4 activity closer to 1.7%. Real final sales to private domestic purchasers held at +2.4% in both Q4 and Q1, suggesting the private economy ran above trend through the worst of the data distortion.
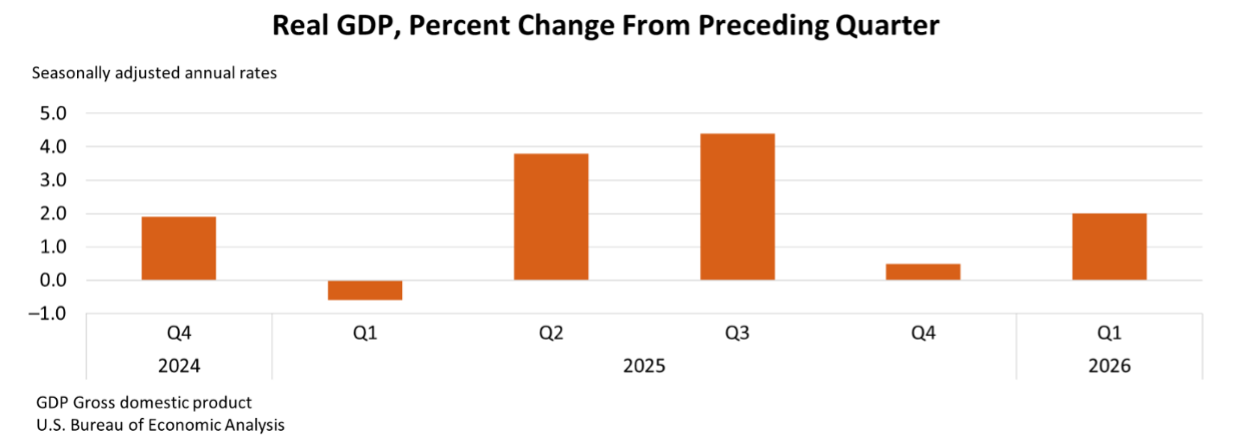
Business fixed investment did the heavy lifting in Q1, with equipment investment up 17.2% and intellectual property products (mostly software) up 13.0%, reflecting the AI capital expenditure buildout that has driven U.S. growth for the past six quarters. Strip that capex out and the underlying consumer and trade picture looks thinner: goods consumption was close to flat, residential construction declined for a third consecutive quarter, and exports were pressured by retaliatory trade measures and the geopolitical shock that arrived in late February. The IMF’s April 2026 Article IV consultation projected 2026 full-year U.S. GDP growth at 2.4% on a Q4/Q4 basis, a reasonable central case if tariffs partially roll back and energy prices ease, though one that deserves a wide error band given the variables in play.
A meaningful share of the Q1 acceleration was mechanical rather than structural. Federal employee compensation rebounded after the furloughs ended, contributing positively to Q1 government spending that would not otherwise have been there. The shutdown effectively borrowed GDP from Q4 and returned it in Q1, which makes both prints partial reads on actual trend growth. The BEA’s July annual revisions may smooth the Q4-to-Q1 swing somewhat but cannot fully reconstruct data points that were not collected at all in October. Practical implication: year-over-year comparisons that straddle this period (H2 2025 vs H1 2026, or full-year 2026 vs full-year 2025) will carry embedded base effects for a long time, possibly permanently, and should always be read with that asterisk in mind.
The inflation data carried a similar caveat in the opposite direction. The November 2025 CPI print came in at 2.7% year over year, well below the 3.1% economists had expected, but BLS could only collect prices for the second half of November rather than the full month and because Black Friday discounting concentrates in the second half of November, the report likely understated true inflation. Independent estimates from the New York Fed and former Fed officials surveyed by Duke University converged on roughly 3% as the true underlying rate, well above what the soft November print suggested. Rate decisions made in December 2025 and January 2026 were therefore taken on GDP and CPI data that both carried shutdown-induced downward bias. The Fed entered 2026 with less confidence in its own picture than at any point since the pandemic.
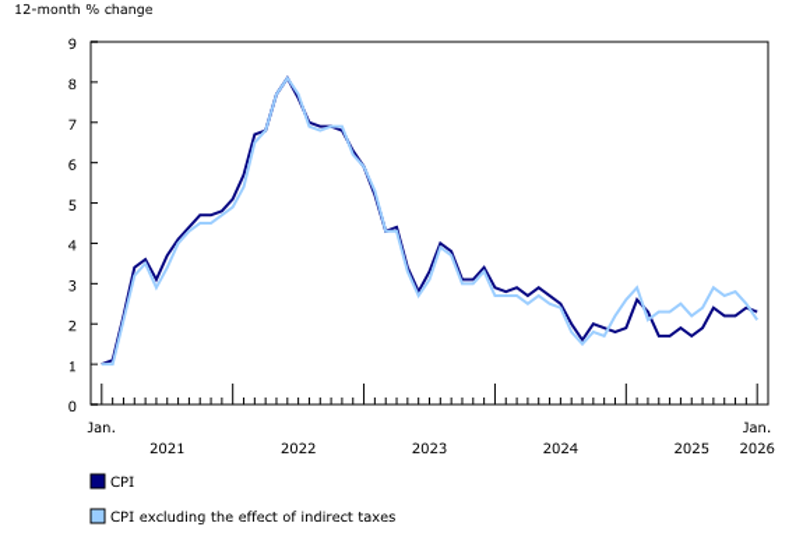
Image 2.2. Unemployment Rate in the U.S (Jan 2022 – Dec 2025)
The geopolitical shock was the most consequential macro event of the quarter. A U.S. military conflict with Iran began February 28, and the immediate economic transmission was through energy. Oil prices rose more than 50% from pre-war levels by quarter end, with Brent crude approaching $115 per barrel at various points; the national average gasoline price moved back above four dollars a gallon for the first time since 2022; and concerns about the Strait of Hormuz (through which roughly 20% of global oil and gas trade volumes transit) became part of every macro conversation. Energy shocks rarely stay in energy. Higher oil and gas prices feed through transportation, petrochemicals, plastics, pesticides, food inputs, and industrial production, and in the longer term, into the input costs of the AI infrastructure build itself: data centers run on power, semiconductors are produced through long supply chains, and physical capacity is increasingly the bottleneck rather than the model layer. The cloud is, in fact, still located on earth.
The March CPI print, the first reading after the war began, showed headline CPI up +0.9% month over month, the largest monthly increase since June 2022, lifting the twelve-month measure to +3.3% from +2.4% in February. Energy CPI rose +10.9% month over month; gasoline alone rose +21.2% month over month and +18.9% year over year. Core CPI held at a more stable +2.6% year over year, with shelter and services-less-energy-services each holding at +3.0%, indicating the inflation impulse was almost entirely energy-driven rather than broad. That is a more manageable reading, and one the Federal Reserve cannot ignore until the energy pass-through into core has clearly run its course.
The Federal Reserve held the federal funds target range at 3.50% to 3.75% at both Q1 meetings, with internal pressure for cuts that did not reach majority support (2 of 12 members). The bind was familiar: the Iran energy shock had nudged the data toward stagflation-adjacent territory, leaving the Fed wanting to ease but unable to without risking another inflation problem. The March statement added an explicit acknowledgement of Middle East uncertainty for the first time. The shift that matters for venture is the rate path itself: markets entered 2026 expecting further easing, the Fed’s March projections still implied one cut for the year, but by quarter end Wall Street had moved to pricing zero cuts. A flatter rate path is a meaningful headwind to venture: the lower-rate recovery thesis that supported software multiples, IPO appetite, and LP risk budgets across 2025 now needs to be re-underwritten without that tailwind.
Bond and equity markets reflected the shift. The 10-year Treasury yield, having briefly touched below 4.0% earlier in the quarter, finished Q1 at 4.30% with the 10-2 yield curve flattening. A continued flattening would edge toward inversion, which has historically preceded every U.S. recession of the past sixty years (though the 22-month inversion of 2022-2024 did so without producing a textbook downturn). For venture, the combination of a higher long-end yield (raising the discount rate on future cash flows) and the recession signal embedded in the curve direction translates into tighter financial conditions and a less hospitable backdrop for the kind of growth-at-any-price valuations that defined 2020 and 2021.
The S&P 500 declined 4.6% in Q1, ending a three-quarter winning streak that had produced nearly 18% in returns across 2025. The Nasdaq Composite declined 7.1%, its weakest quarter in several years, as investors questioned the timing and durability of returns from AI capital expenditure commitments. Public software multiples moved toward multi-year lows as agentic AI raised the possibility that some workflows, seats, and pricing models could be compressed faster than previously assumed. The rotation underneath the index level mattered as much as the headline decline: the equal-weighted S&P 500 was modestly positive, the Russell 2000 returned +0.6%, and energy was the unambiguous winner, up 38.3% for its best quarter since Q1 2022. The VIX closed the quarter around 22, elevated but not panicked given what the quarter had contained.
Labor markets were uneven but not broken. Nonfarm payrolls swung from +160,000 in January to -133,000 in February (one of the few negative monthly reads in recent years) before rebounding to +178,000 in March. The unemployment rate closed Q1 at 4.3%, having briefly touched 4.4% in February. Labor force participation drifted lower from 62.1% in January to 61.9% in March. Average hourly earnings grew +3.5% year over year in March. Healthcare added the most jobs of any sector in March at +76,000. Federal government employment declined another 18,000 in Q1 and now sits 355,000 below its October 2024 peak, a structural shift more visible in labor data than in the federal budget. The broader pattern is what economists are now calling a low-hire, low-fire market: employers are not laying off workers aggressively, but they are also not hiring with the confidence of an earlier cycle.
Technology was the obvious negative outlier: announced tech job cuts were up 51% year over year and accounted for more than 20% of total U.S. layoffs, with AI cited as the rationale for 8% of job-cut plans in Q1, up from 5% in 2025 and 3% in 2023. As an aside, I believe the AI attribution deserves some skepticism. A meaningful share of the AI-cited cuts is closer to AI-washing: a more forward-looking narrative for an earnings call than acknowledging that the same companies overhired aggressively through 2020 and 2021 on the assumption that pandemic-era growth rates would persist. Some of these cuts are real AI substitution. Much of the rest is corporate cover for a headcount correction that was coming regardless.
Consumer spending remained positive but increasingly uneven, and the concentration concern I flagged in Q3 has not improved. Wealthier households continued to spend; lower- and middle-income consumers faced higher energy costs, sticky food prices, and elevated borrowing costs. The split is the same one I described last fall: the top 10% of U.S. households, who own roughly 87% of all stocks, now account for nearly 50% of total consumer spending, which means the durability of that spending depends on the same financial markets driving the AI rally. If public equities stabilize, demand holds. If AI-related equity valuations move meaningfully downwards, the wealth effect that has been propping up headline GDP could unwind quickly.
In a market where oil prices, AI capex, public software multiples, and Fed policy are all pulling on the same thread, it is worth being careful before declaring the sweater intact. For venture-backed companies, this means a higher cost of capital, a less hospitable backdrop for late-stage rounds anchored to 2020 and 2021 pricing, and a public-private valuation compression that has to resolve somehow.
U.S. Venture Capital Landscape
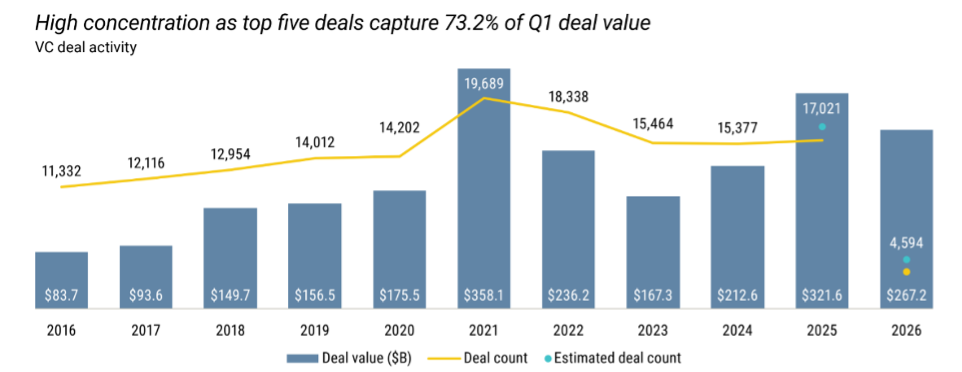
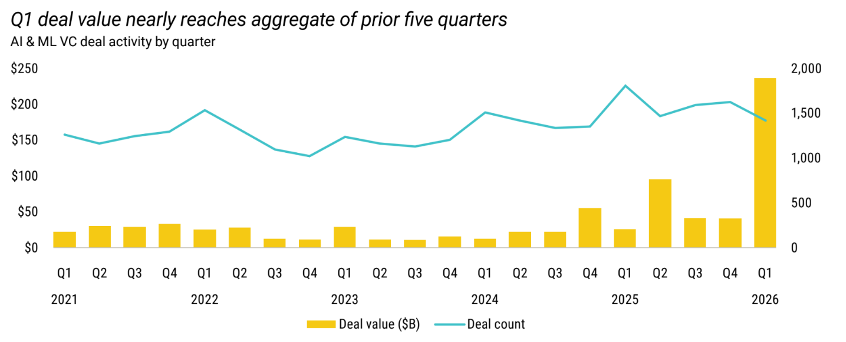
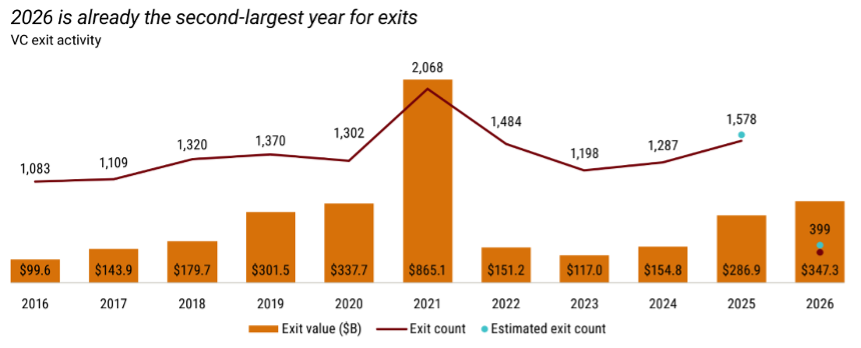
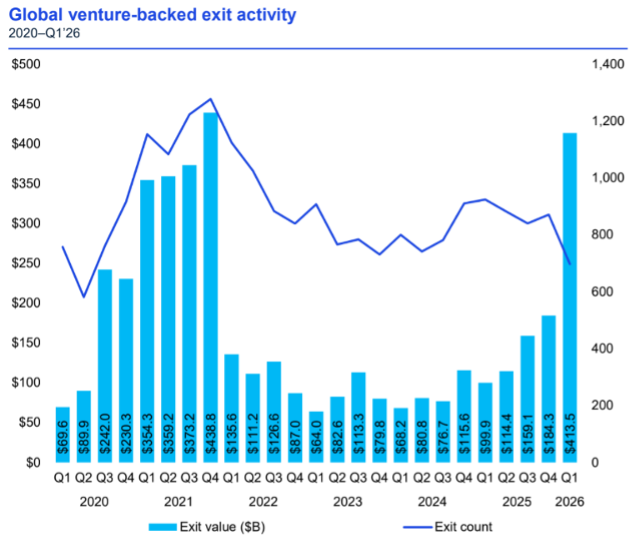
The U.S. venture market in Q1 2026 produced one of the most visually impressive and analytically misleading quarters in the history of the asset class. Deal value reached USD $267 billion, a quarterly record exceeding every full-year U.S. VC total except 2021 and 2025. Exit value reached USD $347 billion, also a quarterly record. The concentration underneath those records was almost theatrical: four U.S. venture rounds closed above USD $15 billion each (OpenAI at USD $122 billion, Anthropic at USD $31 billion, xAI at USD $20 billion, Waymo at USD $16 billion, Databricks at USD $7 billion), with those five companies alone absorbing USD $196 billion. Five companies in three months in 2026 exceeded the entire USD $167 billion deployed across all of 2023. Strip out those five deals and the rest of the U.S. market deployed roughly USD $72 billion in Q1, closer to the 2024 quarterly run-rate of about USD $53 billion than to 2025’s quarterly average of about USD $80 billion. Strip out the five largest exits and the rest of the market returned USD $47 billion, well below the 2025 quarterly exit average of roughly USD $72 billion. Concentration has defined venture for years; Q1 marked a new extreme.
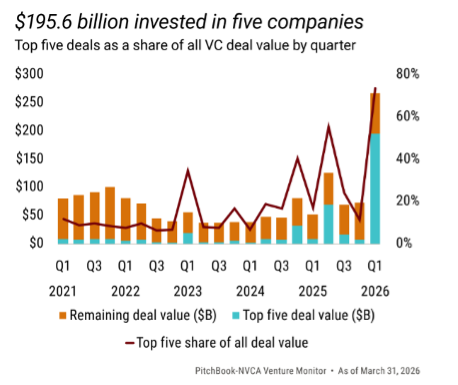
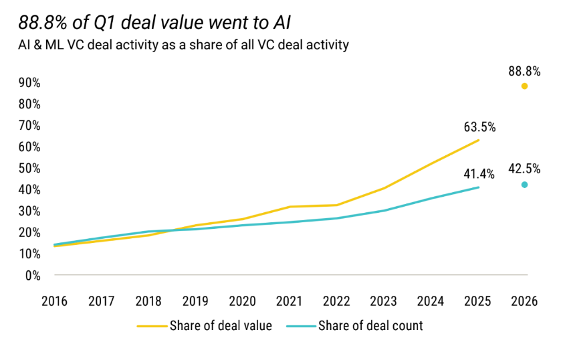
AI and machine learning companies captured 89% of U.S. VC deal value in Q1, up from 64% in full-year 2025 and 41% in 2024. Some of that is mechanical, driven by the five mega-rounds. Some is structural: AI represented 43% of all completed deals in Q1, up from 15% a decade ago. Median pre-money valuations now carry an AI premium at every stage: Series B at USD $271 million vs USD $174 million for non-AI; Series C at USD $607 million vs USD $507 million; Series D+ at USD $4.7 billion vs USD $1.3 billion. Median AI valuation step-ups averaged 2.2x against 1.6x for non-AI. AI-backed companies move from first round to second round in a median of 1.3 years against 1.8 years for non-AI. That is a different lifecycle, not just a different premium: AI and non-AI startups are operating in two parallel venture markets with different costs of capital, speeds of progression, and bars to clear.
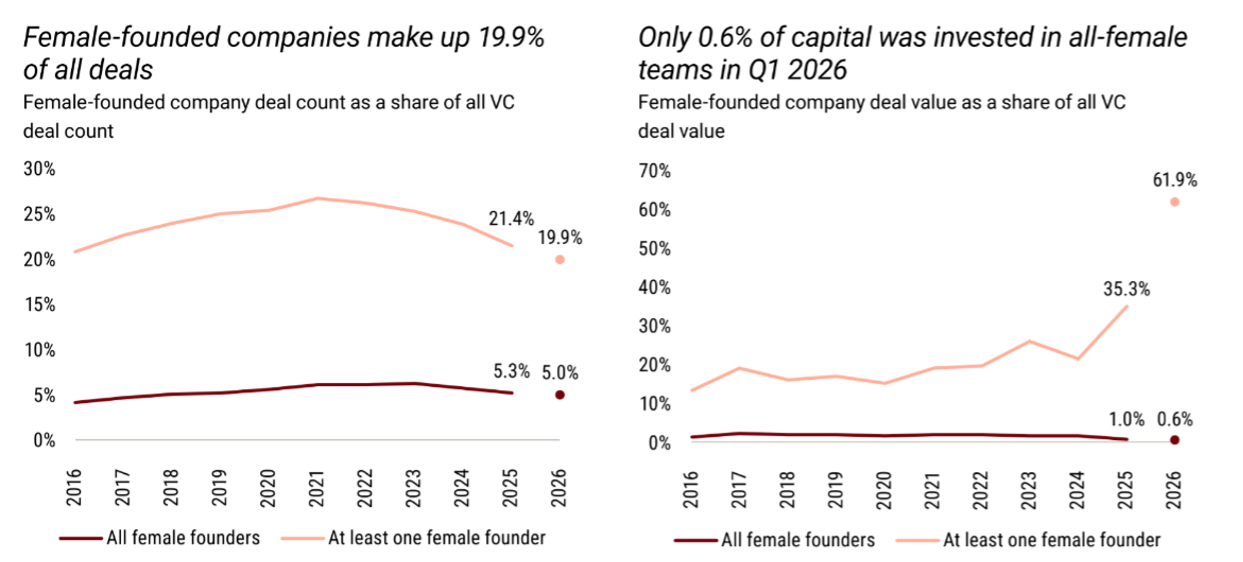
Founder demographics tell a parallel story within that AI concentration. Companies with at least one female founder represented 20% of Q1 deal count; all-female founding teams represented just 5%. In dollar terms, companies with at least one female founder captured 62% of deal value, but that figure is almost entirely an OpenAI and Anthropic distortion; all-female founding teams captured 0.6% of capital. This is the same familiar problem wearing a new AI costume: aggregate dollars can look inclusive when one or two outlier companies distort the numerator, while underlying access remains stubbornly thin.
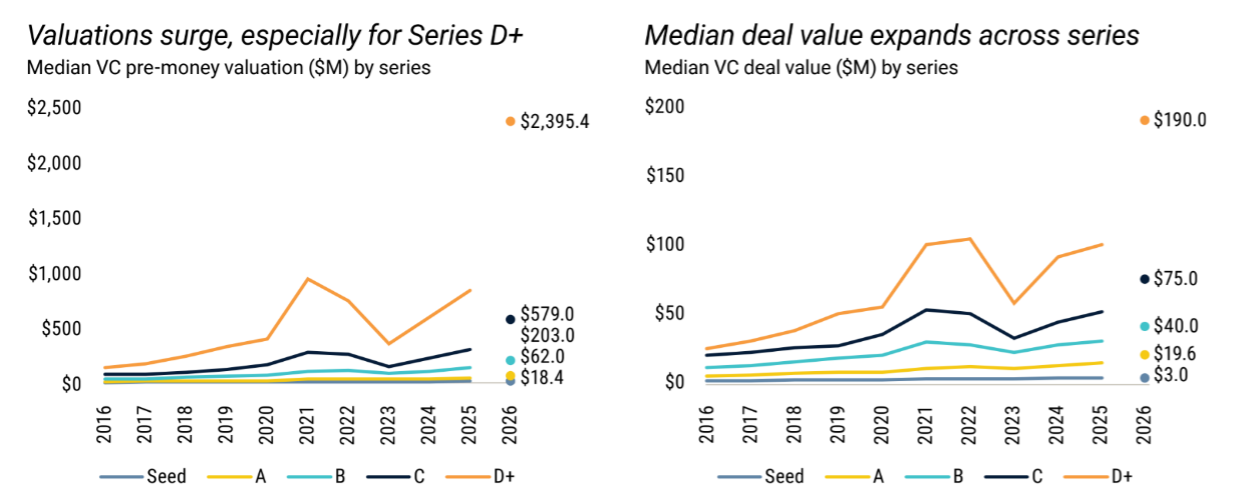
Outside the mega-round universe, the rest of the market reflects what PitchBook reasonably calls an era of consensus deals. Median pre-money valuations have moved higher at every stage: seed at USD $18 million (more than double the 2021 level), Series A at USD $62 million (nearly triple 2020’s USD $21 million), Series B at USD $203 million, Series C at USD $579 million (vs USD $167 million in 2020), and Series D+ at an almost comical USD $2.4 billion, distorted by the AI mega-round set but real for the companies that can attract it. Median deal sizes across stages now sit at USD $3 million at seed, USD $20 million at Series A, USD $40 million at Series B, USD $75 million at Series C, and USD $190 million at Series D+. The gap between median and average is doing as much work as either number alone: at Series A, USD $20 million median against a USD $40 million average; at Series C, USD $75 million median against a USD $125 million average. The largest rounds pull the averages upward while the middle of the market remains far more constrained. Averages are doing what they often do in venture: making the room look wealthier because one billionaire walked in.
The valuation mechanic is direct but uneven. Lower public software multiples compress expected exit value, which is what underwrites early-stage valuations: if the exit ceiling falls, the upstream pricing chain has to absorb it eventually. That mechanic is operating unevenly in Q1 2026. The largest AI companies remain in a parallel market where growth rates are unlike anything venture has previously underwritten: Anthropic, for example, reportedly grew its annualized revenue to approximately USD $44 billion by May 2026, ~10x from twelve months earlier at a starting base that would historically be considered late-stage. For the significant majority of the market that does not look like Anthropic, the compression should pressure private valuations, and underneath the headline data, it already is.
Median pre-money valuations rose at every stage in Q1, but that reflects survivorship bias: the rounds that closed concentrated in the strongest companies under elevated selectivity. This survivorship pattern has been visible in the data since at least Q3 2025, when sub-USD $5 million rounds fell to a decade low and median time-to-close on new funds stretched past 15 months. Deal counts are down, fundraising cycles have stretched further, insider extensions and bridge rounds remain elevated, and the evidentiary bar before a priced round closes has risen materially. The compression is happening. It is being absorbed through delayed price discovery rather than visible markdowns. When the bridges run out and the next priced rounds come due, the picture will be clearer. The question is when, and in whose direction.
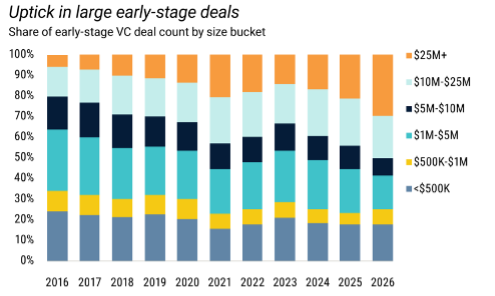
Early-stage activity showed real resilience, but the interpretation is mixed. Over the past four quarters, early-stage deal counts have increased more than other stages, partly because aging dry powder has to be deployed and partly because the most active firms accelerated seed and Series A activity. In Q1, Andreessen Horowitz and Y Combinator each made 46 investments, General Catalyst made 25, and Sequoia made 22. The market is not, however, uniformly founder-friendly. Half of all early-stage deals in Q1 exceeded USD $10 million, the highest share in the past decade, which drives up seed valuations, raises the bar to participate, and amplifies the divergence between early-stage companies with credible AI positioning and credible technical teams and those without. It is founder-friendly for the right shape of founder. For everyone else, the bar continues to rise.
Geographic concentration tracked capital concentration almost perfectly. The Bay Area absorbed USD $221 billion across 669 deals, or 83% of all U.S. Q1 VC value. The four hub markets together (Bay Area, New York, Los Angeles, Boston) captured 91% of all Q1 venture dollars and 98% of all venture-growth-stage dollars. Venture has always been a hub-driven asset class. It is more so now than at any point in the past decade.
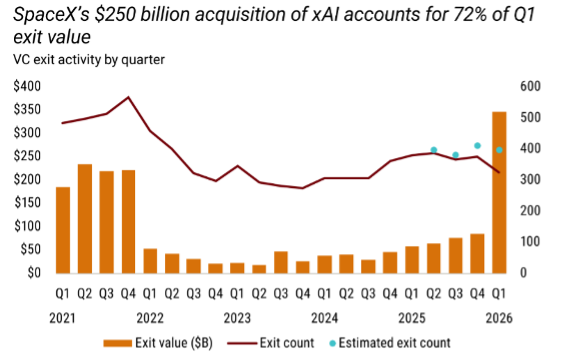
The Q1 exit value headline disguises the cash. SpaceX’s USD $250 billion acquisition of xAI accounted for 72% of the USD $347 billion figure, and the transaction is most accurately described not as a third-party acquisition but as a consolidation of two affiliated Musk-controlled assets. Distributions to limited partners are not created by theoretical exit value alone; they are created by realizable liquidity, lockup mechanics, and actual cash or liquid shares returned to funds. Excluding the xAI-SpaceX transaction, Q1 exit value was USD $97 billion, still the highest quarterly figure since Q4 2021. That is the more honest read. Acquisition activity beyond xAI reflected the AI consolidation theme that has defined exit markets since mid-2025: Google finalized its USD $32 billion acquisition of Wiz, the largest corporate acquisition of a VC-backed company on record; Marvell Technology acquired Celestial AI for USD $6 billion for high-bandwidth, low-latency AI connectivity infrastructure; and Palo Alto Networks acquired observability platform Chronosphere for USD $3.4 billion. Acquirers are building AI capability stacks through acquisition rather than internal development, creating a durable exit channel for companies with measurable AI-adjacent value even when public market issuance is constrained.
The IPO market had a more complicated quarter than the exit headline implied. The first two months of 2026 produced genuine activity: EquipmentShare raised USD $747 million on Nasdaq and traded up 16% on its first day, York Space Systems raised USD $629 million, BitGo raised USD $213 million, and biotech contributed meaningfully with Eikon Therapeutics and Aktis Oncology both completing strong raises. Fifteen VC-backed IPOs completed in Q1, putting 2026 on pace for approximately 60 listings (above 2025’s 50). Then the Iran war started in late February, and the IPO market largely froze. The mega-IPO pipeline that loomed over the quarter has stopped being theoretical since quarter-end: SpaceX filed an S-1 on May 20 targeting approximately USD $1.75 trillion, with pricing scheduled for June 11 and a Nasdaq debut as SPCX, in an offering expected to raise more than USD $70 billion against Saudi Aramco’s USD $29.4 billion record from 2020. OpenAI followed with a confidential S-1 on May 22 at a USD $852 billion to USD $1 trillion valuation range and a Q4 2026 listing target, led by Goldman Sachs and Morgan Stanley. Anthropic priced a USD $65 billion Series H on May 28 at a USD $965 billion post-money valuation, with bankers discussing a Q4 2026 IPO that could raise above USD $60 billion, though no S-1 has yet been filed. Combined, those three companies alone represent more than USD $3.5 trillion in potential debut market capitalization, more than the aggregate value of all U.S. IPOs this century. That is either the largest liquidity event in the history of the asset class, or a reminder that the asset class has never been more dependent on the outcome of a handful of companies. Probably both.
A second-order risk worth flagging has not received much attention. Index methodology changes since the SpaceX filing have meaningfully shortened the path to broad-market passive exposure. Nasdaq’s revised Nasdaq-100 methodology, effective since May 1, 2026, allows any newly listed company in the top 40 by market cap to enter the index after just 15 trading days; SpaceX is on track to become roughly a 4% weight in the Nasdaq-100 within weeks of debut, which mechanically forces buying across QQQ (currently above USD $300 billion in passive AUM) and every other Nasdaq-100 tracker. S&P Dow Jones Indices is separately consulting on rule changes that would cut S&P 500 seasoning from twelve months to six and waive the positive-earnings requirement for megacaps, putting SpaceX on a probable path into the S&P 500 in Q4 2026 or Q1 2027 at approximately a 2.4% index weight. Once a USD $1.75 trillion company sits inside both indices, the mechanic is straightforward: passive inflows lift the stock on the way up and force mechanical selling on the way down, and a meaningful correction in SpaceX shares translates into broad-market drawdown for every passive vehicle tracking those indices. The wealth-effect channel I described earlier would amplify the macro pass-through: it is a tail risk worth monitoring through the second half of 2026 and into 2027.
Global Venture Capital Landscape
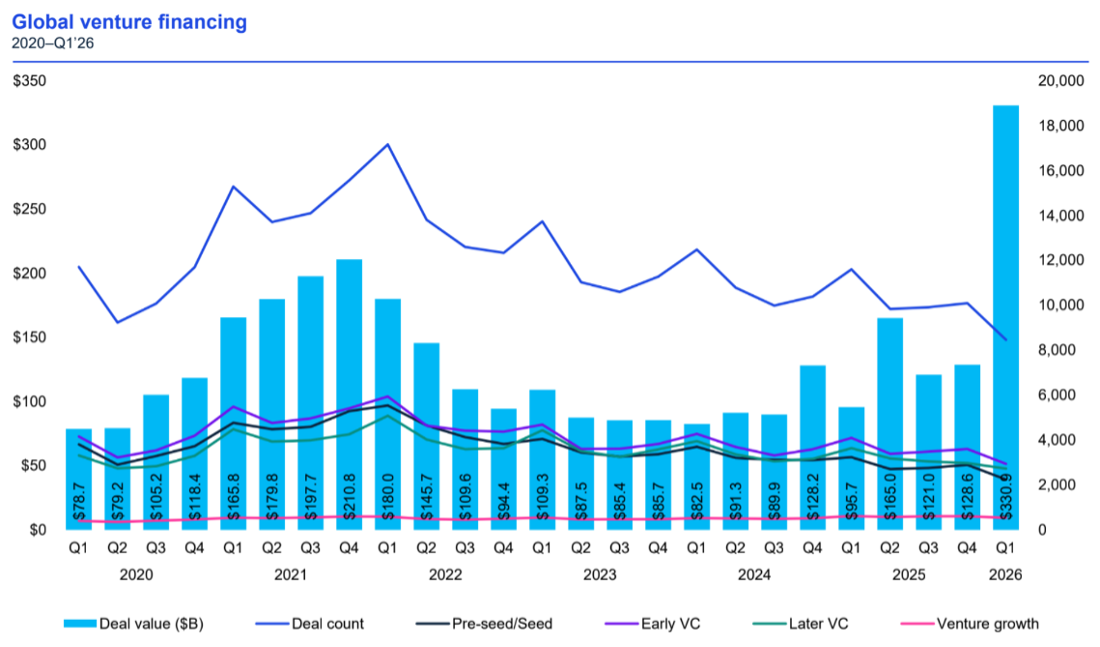
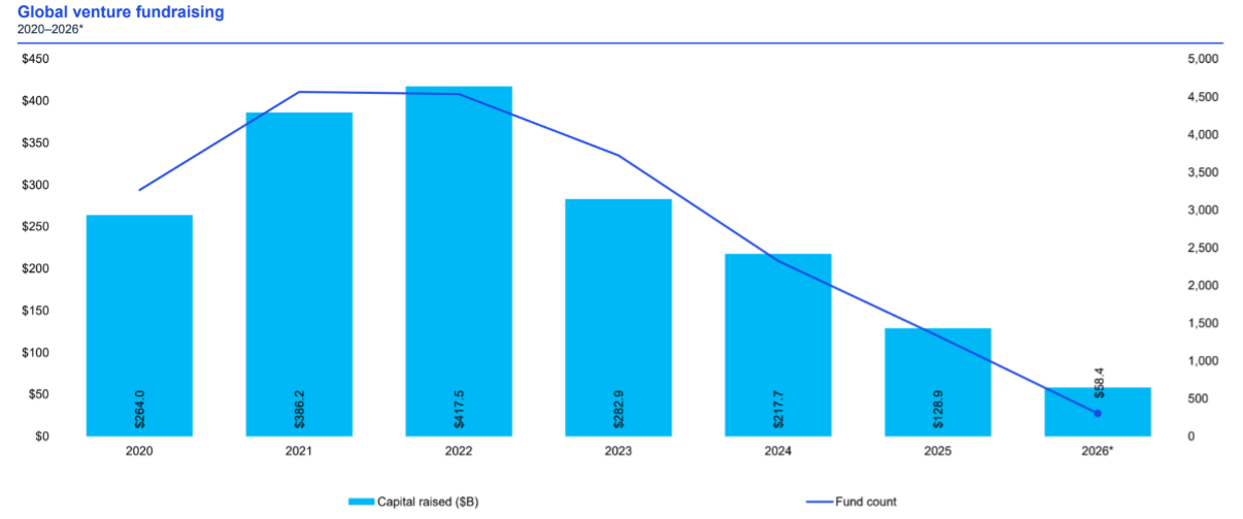
Global Q1 2026 venture investment was USD $331 billion across 8,464 deals, more than doubling from USD $129 billion in Q4 2025 and surpassing the previous peak of USD $211 billion set in Q4 2021. The 157% quarter-over-quarter increase looks like broad acceleration; it is concentrated distortion. The same five U.S. AI companies that dominated the U.S. tally collectively accounted for USD $196 billion, or roughly 59% of all global VC deployed in Q1. Strip them out and the remaining USD $135 billion in global deployment is a reasonable quarter in line with 2024 and 2025 pacing. The global market is best understood not as a recovery but as a clarification of capital’s preferences: AI over everything, North America over everywhere else, established managers over emerging ones, scale over breadth.
The Americas captured roughly 82% of global investment with USD $277 billion across 3,618 deals, almost entirely a U.S. AI story. The San Francisco Bay Area continues to anchor global venture capital in a way no other geography approaches. Outside the United States, Brazil started softly on a combination of election-year uncertainty and a slower fintech pace, with much of the early-stage activity coming from angels and seed funds; Mexico held nearly steady at roughly USD $461 million, supported by continued fintech demand and cross-border payments activity.
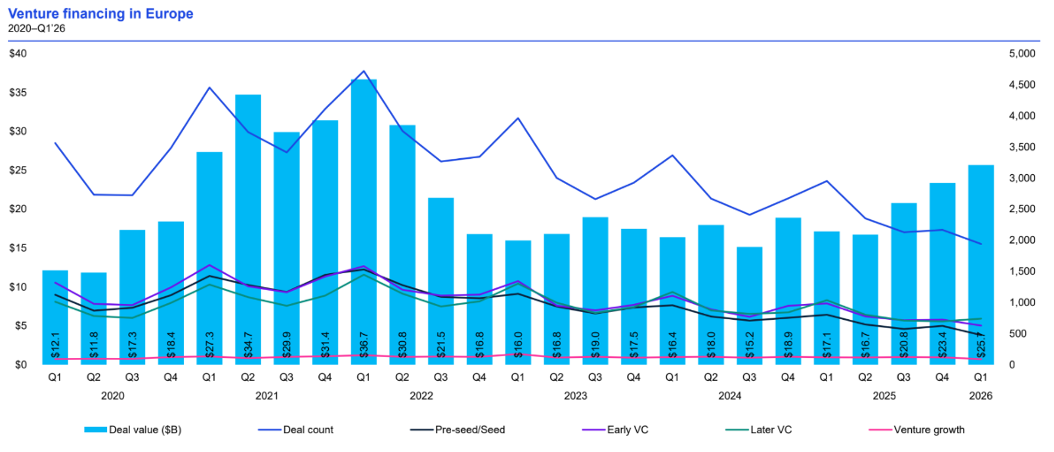
Europe had its best quarter in several years with USD $26 billion deployed, a 14-quarter high, including six rounds at USD $1 billion or above. The sector spread is instructive: AI compute infrastructure (UK-based Nscale at USD $2.0 billion), humanoid robotics (Germany-based Neura Robotics at USD $1.8 billion), autonomous driving (UK-based Wayve at USD $1.5 billion), distributed energy management (Germany-based Cloover at USD $1.2 billion), and a USD $1.0 billion seed financing into France-based Advanced Machine Intelligence, a round size that effectively redefines the stage label. Europe is increasingly assembling its own sovereign-relevance thesis around physical defensibility and domestic IP retention, reinforced by defense procurement decisions across the region. What Europe has not yet solved is fundraising: regional fund formation totaled just USD $4.1 billion in Q1, well behind deployment and increasing reliance on the same pool of incumbent managers. Whether Q1’s deployment level holds across subsequent quarters or proves a vintage anomaly is the open question for European venture in 2026.
Asia reached USD $34 billion in Q1 VC investment, up from USD $26 billion in Q4 2025 and a 12-quarter high, with the largest rounds clustered in AI, data center infrastructure, and reusable rocketry across China and Singapore. The Hong Kong Stock Exchange saw the first IPOs of China-based generative AI platforms (Zhipu AI and MiniMax), signaling a partial reopening of the Asian public exit channel. India continued to operate below its 2021 peak. The region shows pockets of strength rather than a synchronized recovery, and the single-quarter high should be read against that uneven texture rather than as a regional acceleration.
Sectorally, AI remained the dominant global theme, but the AI story has shifted. In 2023 and 2024, AI investment concentrated on foundation models and application-layer enthusiasm. By Q1 2026, the story was increasingly about physical infrastructure: power, chips, cooling, data centers, autonomy, and specialized hardware. Autonomous vehicles attracted significant capital (Waymo at USD $16 billion in the U.S., Wayve at USD $1.5 billion in the U.K., and large rounds in China and Japan), reflecting a shift in investor framing from "can autonomy work" to "where does autonomy work first, at scale, with tolerable regulatory and unit-economic risk." Defense tech, spacetech, and cybersecurity continued to attract capital, supported by geopolitical tension and government procurement priorities, increasingly intertwined with AI rather than separated from it. Dual-use technology is becoming a bridge between venture capital and national security policy. The venture market is rediscovering that even software revolutions require very real-world inputs: intelligence still needs atoms.
U.S. Digital Health Landscape
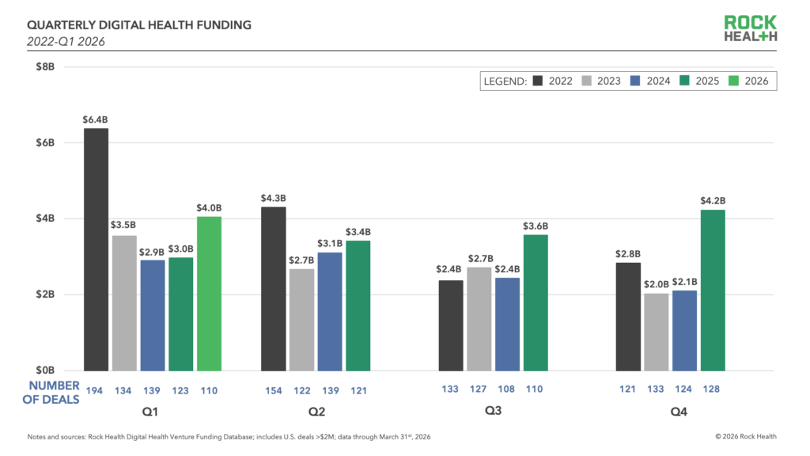
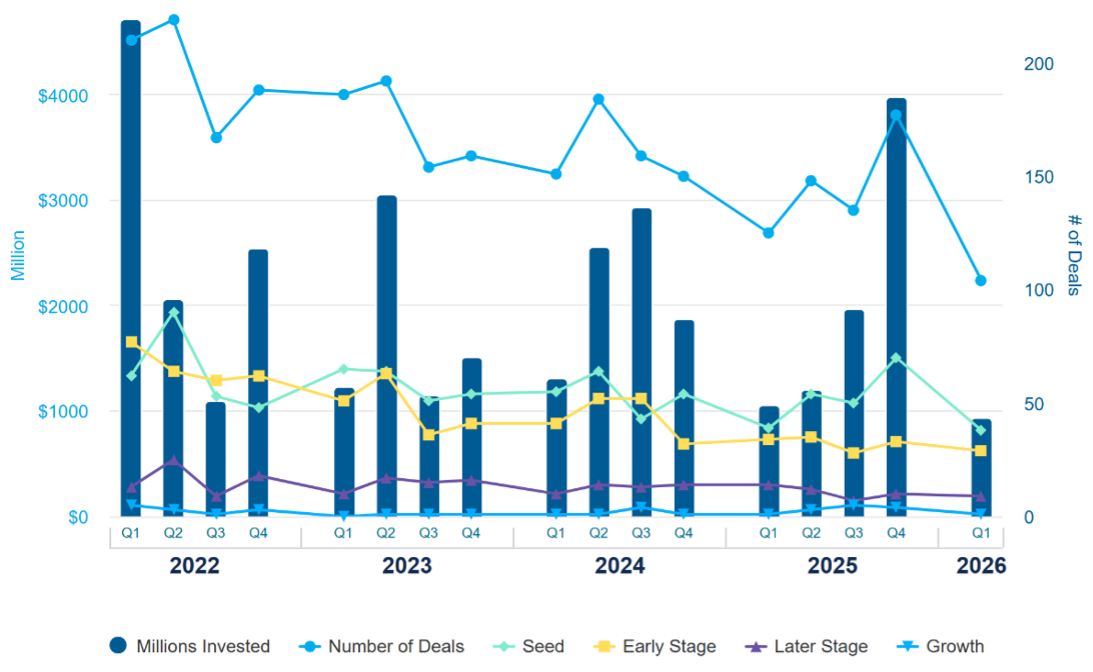
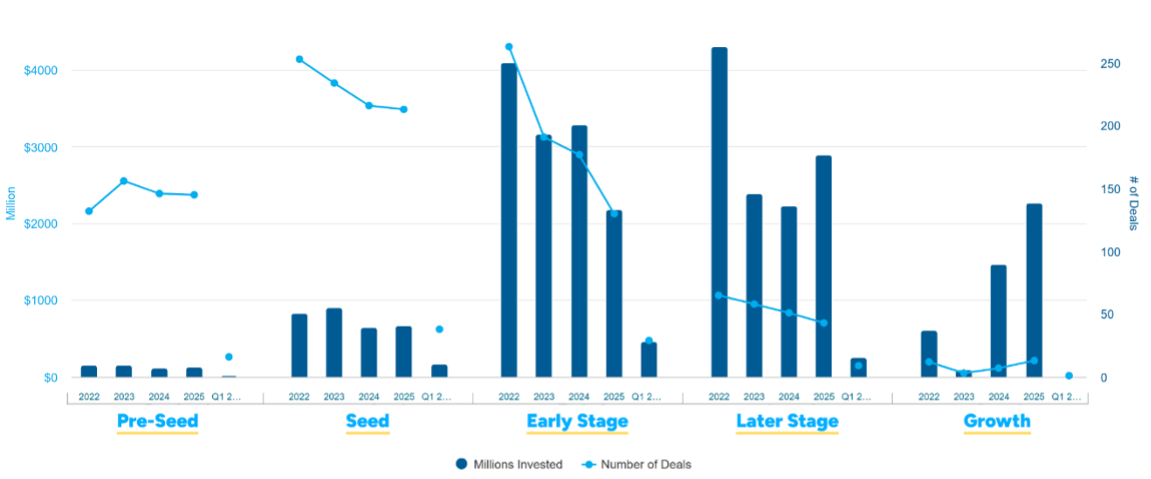
U.S. digital health entered 2026 with stronger momentum than many in the sector expected. Q1 funding reached USD $4.0 billion across 110 deals, a 33% increase in capital from Q1 2025’s USD $3.0 billion against a 10% decline in deal count from 122. Average deal size climbed to USD $37 million, the highest single-quarter average Rock Health has tracked since Q4 2021 and up from USD $33 million in Q4 2025. The trajectory 2025 established is now visible at higher amplitude: digital health funding is growing in absolute terms, shrinking in deal count, and concentrating into fewer, larger transactions at an accelerating rate.
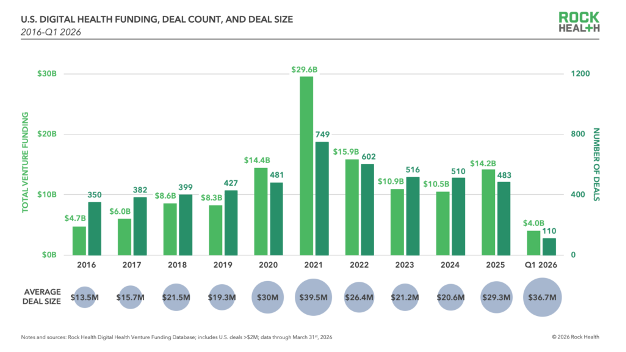
The concentration was striking. Twelve mega-deals of USD $100 million or above accounted for 59% of all digital health capital deployed in Q1, one of the highest single-quarter concentration ratios Rock Health has ever tracked, exceeded only by Q1 2021 at 62% and Q4 2021 at 61%. If Q1’s pace holds, 2026 closes with approximately 50 mega-deals, nearly double last year’s count. "Annualizing Q1" remains one of finance’s more beloved forms of fiction, but the pattern is clear regardless.
The top Q1 financings show where investor conviction is clustering. Wearable company Whoop raised USD $575M in a Series G at a USD $10.1B valuation, nearly triple its previous valuation, on USD $1.1B in disclosed ARR, with an IPO reportedly in preparation. OpenEvidence closed a USD $250M Series D in its third round in under a year, at over USD $100M in revenue, with its AI medical search engine used daily by more than 40% of U.S. physicians. Talkiatry raised USD $210M as the nation’s largest private employer of psychiatrists, on reported 1,745% revenue growth between 2021 and 2024. eMed raised USD $200M at a USD $2B+ valuation for an agentic AI platform focused on employer GLP-1 and capitated care. The remaining eight USD $100M+ rounds went to Verily (USD $300M for AI roadmap acceleration as it spins out from Alphabet), mental health platform Grow Therapy (USD $150M on approximately USD $1B in revenue and 7 million annual visits), Honest Health (USD $140M for Medicare value-based care), patient advocacy platform Solace (USD $130M Series C, became a unicorn), Qualified Health (USD $125M for an AI adoption and governance platform for health systems serving 400,000 users), Garner Health (USD $118M Series D at a USD $1.35B valuation on 130% year-over-year revenue growth), Cognito Therapeutics (USD $105M to commercialize an Alzheimer’s neurostimulation device), and women-in-midlife virtual care provider Midi Health (USD $100M, also a new unicorn at more than 230,000 patients). That is a long paragraph because it was a very expensive quarter.
What these twelve transactions show is what is now working in digital health at scale: companies with measurable revenue traction, clinically validated distribution, reimbursement clarity, and either AI-driven operating leverage or direct-to-consumer reach. Whoop’s near-tripling on disclosed ARR is the kind of price action that reminds the market that durable consumer health infrastructure can command premium multiples when growth and engagement are verifiable. OpenEvidence’s 40% daily physician adoption is a clinical distribution metric a decade of health tech investment struggled to produce, and the company achieving it in under three years with an AI-native product is a structural signal about how clinical decision support is now reaching the point of care.
The most consequential development of the quarter was not a financing. It was a category retirement. Rock Health announced it is retiring its "AI deal" tracking analysis on the basis that the distinction between AI-enabled and non-AI digital health companies has become meaningless. When AI is table stakes rather than a differentiator, tracking it as a separate category tells you nothing about which companies are building defensible businesses. The new question is whether AI is embedded deeply enough in workflow, distribution, or clinical evidence to be defensible. When every company has AI, the moat becomes whatever the company has built around AI that a customer cannot replicate, an EHR cannot unwind, or a payer cannot easily reprice.
That structural question collided with a parallel structural development. Five major consumer AI platforms launched healthcare-specific consumer products within a ten-week window in Q1. OpenAI launched ChatGPT Health on January 7, citing 230 million weekly health-related queries already running through ChatGPT and partnering with b.well and Function Health for record and lab data. Anthropic launched Claude for Healthcare on January 11, timed to the JPMorgan Healthcare Conference, partnering with HealthEx for patient record connectivity. Amazon launched Health AI on January 21 through its One Medical subsidiary as an agentic AI tool for appointments, medications, and lab interpretation, later expanded to all U.S. customers in March. Microsoft opened a waitlist for Copilot Health on March 12, drawing from HealthEx and over 50,000 U.S. hospital and provider organizations. Perplexity launched Perplexity Health on March 19 with a personal health dashboard mapping a ten-year health outlook against current labs, vitals, and conditions. None of these companies is a traditional digital health entrant. All of them are positioning as the front door to care.
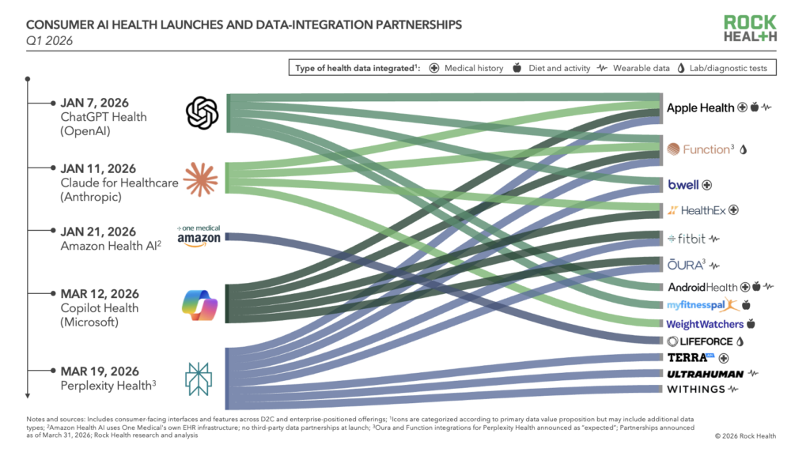
If two or three of these platforms become the dominant interface between consumers and health information, the digital health companies building on top of them inherit the leverage dynamics of the App Store era. Distribution that runs through someone else’s platform is not really distribution. It is access, and access can be repriced. Nimbus is watching closely which digital health categories retain independent distribution and which effectively become features of a larger platform.
Digital health is also recommitting to direct-to-consumer business models. Investors had begun "dipping their toes" back into D2C in 2025; by Q1 2026, it looked more like a deliberate step back in, supported by clearer FDA guidance on low-risk wellness products, telehealth flexibilities extended through 2027, and growing confidence in consumer engagement. Maven Clinic launched D2C pathways alongside its enterprise business; Hims & Hers acquired Australian telehealth platform Eucalyptus to expand internationally; wellness brands continued to roll out D2C lab testing alongside their core offerings. The category is not as overheated as it was in 2020-2021, but it is no longer being avoided.
The exit environment for digital health remained constrained relative to funding activity. M&A generated 43 transactions in Q1, an uptick from Q4 2025’s 30. Quarterly digital health M&A counts have been choppy across 2024 and 2025, so this is best read as another data point in an oscillating series with an upward bias rather than a clean trend reversal, directionally consistent with the consolidation pattern of the past eighteen months. Acquihires continued to contribute: OpenAI acquired Torch, Headway acquired the Tezi team. The quarter’s most anticipated transaction did not close: New Mountain Capital’s plan to combine five portfolio companies into a USD $32 billion AI-focused health technology platform called Thoreau fell apart in March over unresolved concerns about debt structure and governance.
Policy is also setting terms. CMMI’s ACCESS Model payment rates went live in February, and CMS reported that applications to participate exceeded expectations. The model rewards measurable outcome improvements at scale and requires technology adoption to reduce operational costs, criteria that favor the kind of AI-enabled workflow infrastructure that has attracted the most digital health capital in recent cycles. With nearly every major payer pledging to adopt aligned payment approaches, the model’s reach extends well beyond Original Medicare’s 33 million beneficiaries. The Office of the National Coordinator for Health Information Technology is simultaneously pushing data liquidity through interoperability requirements and information blocking enforcement, creating the structural conditions for AI health platforms to access the longitudinal data that makes their products defensible.
For Nimbus, the implication is that U.S. digital health is investable. The category has regained capital momentum, but investor appetite is concentrated in companies that combine technology with distribution, workflow ownership, reimbursement clarity, and measurable operating leverage. The more regulated and operationally complex the workflow, the harder it is to build, but also the more defensible it can become. Healthcare’s difficulty remains its moat, which is a very healthcare sentence and unfortunately true.
Canadian Venture Capital Landscape
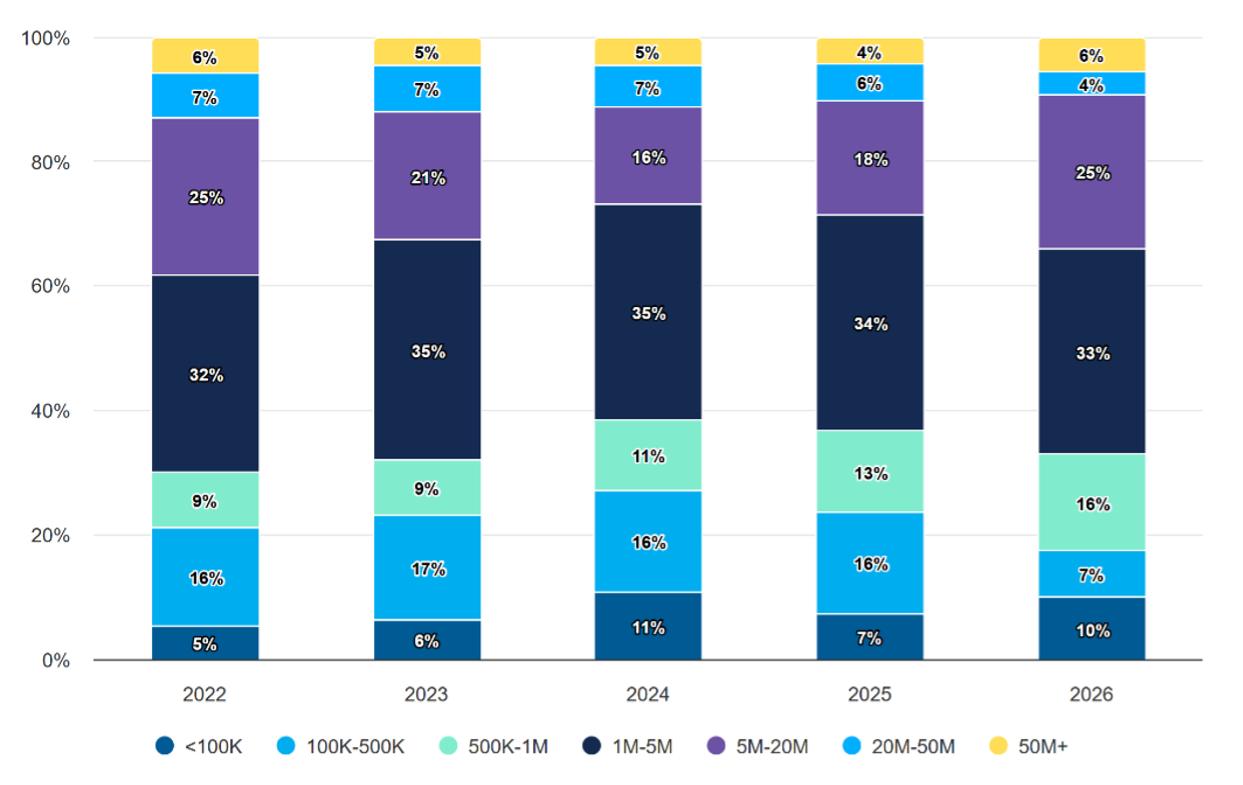
Canada’s venture market in Q1 2026 was resilient in the way someone says they are "fine" while clearly holding the chair together with duct tape. The quarter unfolded under a three-way pressure test of U.S. tariff uncertainty, a domestic economy growing barely above stall speed, and a geopolitical shock layered onto an existing trade environment, all while the Liberal government under Mark Carney settled into office. CVCA reported $936 million invested across 104 venture transactions in Q1, the lowest first-quarter deal count since 2021. The decline from Q4 2025’s $3.8 billion across 165 transactions was sharp and made the headline look weaker than the underlying activity actually is. Capital deployed remained above most pre-2021 first-quarter levels, average deal size rose 6% year over year to $9 million, and the year-over-year decline in total invested capital was only 12%. The pattern is consistent with the "fewer but larger" dynamic that has characterized Canadian venture across the past several cycles.
The quarter’s structural configuration was unusual because capital appears to have shifted toward earlier stages. Pre-seed through early-stage transactions accounted for roughly 70% of capital deployed ($651 million). Pre-seed and seed alone captured a record ~20% of quarterly capital, totaling $185 million across 54 transactions against a five-year first-quarter average of approximately 9%. Average seed deal size reached $4.5 million, a 37% increase relative to the five-year average. Early-stage investment totaled $466 million across 29 transactions with an average deal size of $16 million. The record share figure requires careful reading. Total Canadian VC activity in Q1 2026 (104 deals) was the lowest first-quarter deal count since 2021, and pre-seed and seed deal count (54) tracks below the 2025 quarterly run rate of approximately 73 deals. What the data describes is selectivity, not breadth: investors are writing larger checks to fewer pre-seed and seed companies. That sustains financing for the strongest startups but does nothing to widen the top of the funnel, which extends the Canadian early-stage concern I have raised in prior quarters rather than reversing it.
The other concerning part is growth capital. Later-stage investment totaled $248 million across nine transactions at an average deal size of $28 million, below the five-year first-quarter average of $55 million. Growth-stage investment was effectively absent against a five-year first-quarter average of $140 million. One quarter does not prove a structural shift, but the absence of domestic growth capital has consequences. It is the stage at which foreign investors typically step in, domestic ownership dilutes, companies become more likely to relocate commercial focus, and acquisition becomes more likely than IPO.
Six mega-deals above $50 million totaled $448 million, or 47% of quarterly capital. The five disclosed mega-deals were lithium refiner Mangrove Lithium at $118 million (BC), backed by BMW i Ventures, Breakthrough Energy Ventures, and the Canada Growth Fund; energy efficiency company Jetson at $69 million (BC); Neo Financial Technologies at $68.5 million (AB); AI automation platform Gumloop at $68 million (BC); and Congruence Therapeutics at $54.1 million (QC). Other notable Q1 transactions included UniUni at $41 million (BC), Kainova Therapeutics at $32 million (QC), and defense technology company Dominion Dynamics at $29.1 million (ON) for a seed round funding Arctic monitoring software. Gumloop’s AI automation round sitting side by side with Dominion Dynamics’ Arctic monitoring seed in Q1’s top transactions captures the two themes pulling global capital into Canada right now: AI software and strategic deep tech, with the latter accelerated by the geopolitical environment.
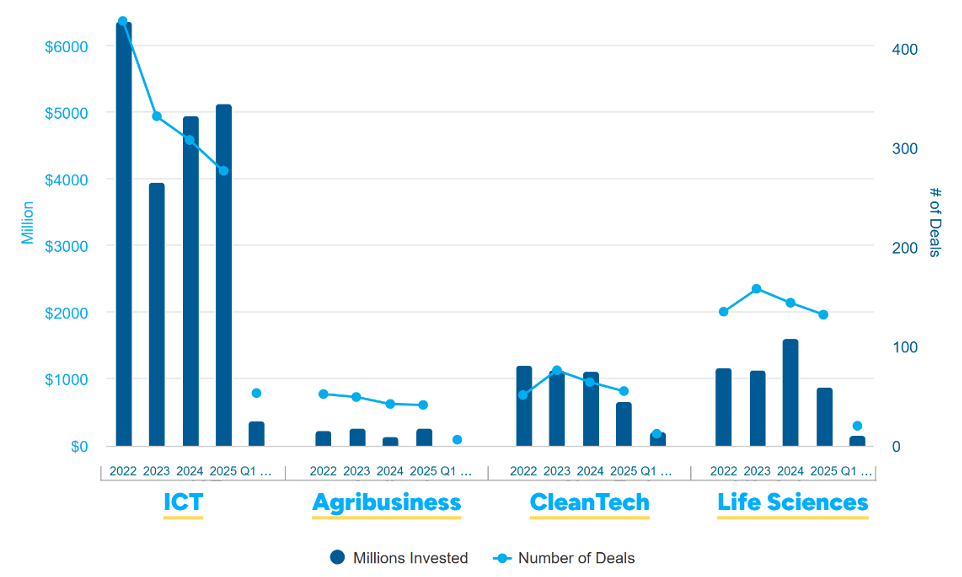
Sector and geographic data show the familiar concentration. ICT led all sectors with 53 transactions and $365 million invested (51% of deal count, 39% of capital, well below ICT’s five-year quarterly share of 59%). Cleantech captured $208 million across 12 transactions (22% of capital), heavily supported by Mangrove Lithium and Jetson; excluding those two, cleantech capital was only $21 million across 10 transactions. Life sciences recorded $158 million across 20 transactions. Geographically, BC led capital with $357 million across 21 transactions, followed by Quebec at $292 million across 22; Ontario led deal count at 41 but attracted only $145 million; Alberta recorded 13 transactions and $97 million, driven by Neo Financial. Montreal led all cities at $271 million across 20 deals, with Vancouver at $105 million across 12, Toronto at $93 million with 23, and Calgary at $92 million and 11.
Venture debt patterns were interesting: CVCA reported seven venture debt transactions totaling $248 million in Q1, the lowest first-quarter deal count since CVCA began tracking in 2017. That single-quarter count compression may or may not persist. The more durable signal is the average facility size, which reached $35 million, up 80% year over year and the highest first-quarter figure on record, extending a multi-year trend toward larger Canadian venture debt facilities that has been building since 2023. Larger average facilities against lower deal count suggest companies are using debt to extend runway in an equity environment where later-stage capital is constrained. That is a rational use of the instrument. It is not a risk-free one. Debt can be an effective bridge to a milestone; it is a poor substitute for product-market fit, gross margin expansion, or investor conviction.
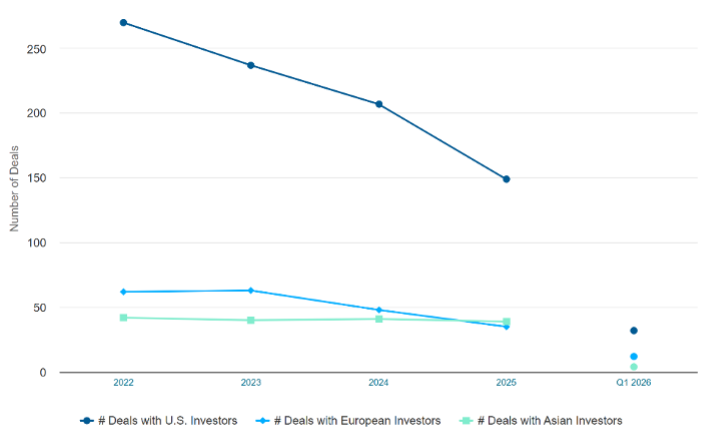
Foreign investor participation recovered in Q1 following the decline through 2025: U.S. investors participated in approximately one-third of Canadian deals (up from late 2025 levels), European participation rose to 8% (up from 5% at year-end), and Asian participation declined to 3% (below the two-year average of 6%). Y Combinator participated in two Canadian deals totalling $86 million, including the Gumloop backing. The improvement is cautiously constructive, but one quarter does not establish a sustained reversal of the multi-quarter decline, and the levels remain well below the broad U.S. interest that characterized the 2019 to 2022 cycle.
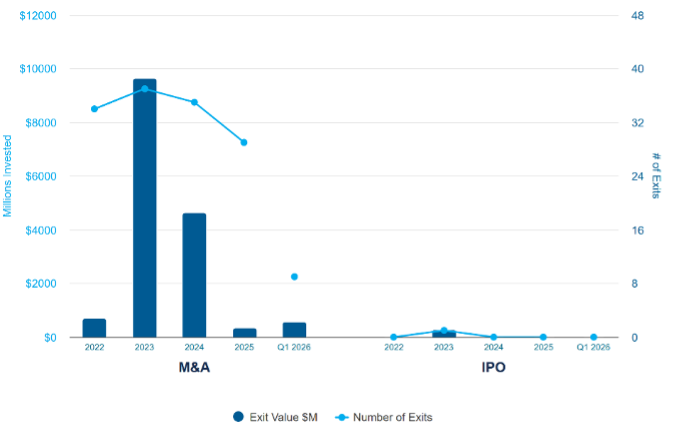
Exit conditions remained constrained. Nine M&A exits closed in Q1 with $572 million in disclosed value, above the $231 million recorded across 10 exits in Q1 2025. No traditional IPOs occurred. Toronto-based Xanadu Quantum Technologies went public via reverse takeover in March 2026, listing on both Nasdaq and the Toronto Stock Exchange, the first Canadian technology company on the TSX since 2021. Vancouver-based General Fusion and defense technology company Juno Industries are expected to pursue similar RTO pathways later in 2026. This continues the familiar Canadian challenge: without robust domestic public market pathways or frequent large strategic exits, capital recycling remains slow. Slow distributions affect LP appetite, which affects fund formation, which affects early-stage financing capacity, which affects the future startup pipeline. Venture ecosystems are circular, which is elegant in theory and frustrating in practice when the circle gets clogged.
For Nimbus, the Q1 Canadian VC picture reinforces the importance of disciplined early-stage investing. The market is not dead; it is markedly thinner across stages. Early-stage capital is still moving, but to fewer companies, and later-stage gaps are widening. That creates both opportunity and responsibility. If we invest early, we need to underwrite not just the next round but the financing path through a constrained Canadian growth market. Priority goes to companies with credible access to U.S. capital, strategic partnerships, non-dilutive funding, revenue milestones, or business models that can scale efficiently without requiring repeated large domestic growth rounds. Canada continues to produce strong companies in health, life sciences, AI, and deep tech. The risk is not talent nor innovation: the risk is whether the capital stack is deep enough to keep ownership, decision-making, and upside meaningfully Canadian.
Capital Formation and Liquidity Cycle
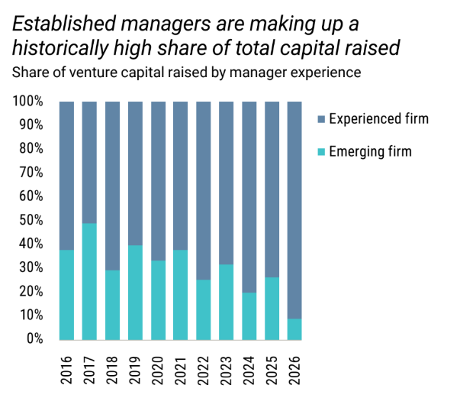
The recovery in deployment that defined Q1 has not yet translated into a recovery in capital formation, and that gap is the structural story of the quarter. U.S. venture funds raised USD $48 billion in Q1 across 172 funds (more than half of 2025’s full-year total in one quarter), but six managers (Andreessen Horowitz, Thrive Capital, Founders Fund, Battery Ventures, Kleiner Perkins, and Lux Capital) captured USD $36 billion, or 76%, of that. Experienced firms captured 91% of capital raised in Q1, up from 74% for full-year 2025 and the highest share on record. The median fund size compressed to USD $15 million from USD $25 million in 2025. More USD $1 billion-plus funds closed in Q1 than during all of 2025. The fundraising market is practically closed to most emerging managers. The barbell that characterized Q1 deployment is mirrored in capital formation as a reinforcing loop: mega-funds raise the capital required to enter mega-rounds, mega-rounds define market returns, and emerging managers struggle to show DPI in a market where liquidity is concentrated in companies they often could not access in the first place.
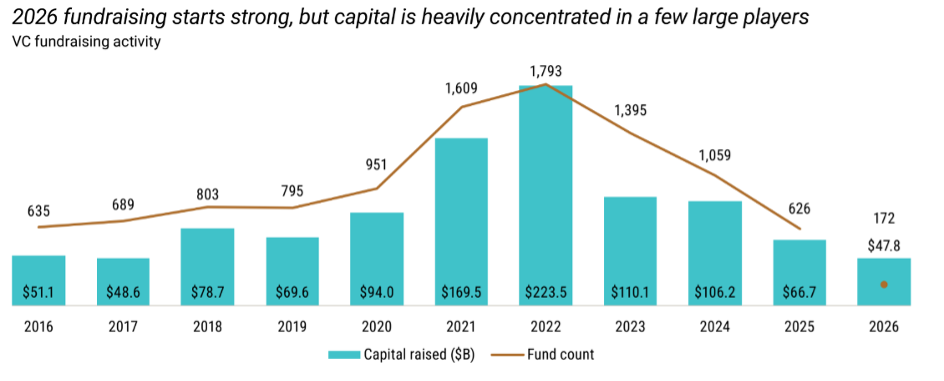
Distributions to LPs remain net negative for what is now nearly four consecutive years, with VC distribution yields near multi-decade lows relative to NAV. The median VC IRR for North American fund vintages since 2019 remains in the single digits, and median DPI for vintages over the past decade remains below 1x. Total U.S. VC dry powder stands at USD $279 billion, heavily concentrated in 2022 through 2025 vintages. The reported time-to-close on new funds looks artificially low in Q1 because the funds that close quickly are those with the strongest existing LP relationships, not because fundraising has become easier. The fundraising market will not broaden until distributions actually return, which requires functioning exit markets at scale, which since quarter-end has become possible (SpaceX, OpenAI, and Anthropic all moved on the public markets in May) but not yet realized. The IPO window cracked open in early Q1, closed under the Iran shock in late February, and is now waiting to see whether the three mega-IPOs trade well enough after debut to reopen it for the rest of the late-stage backlog.
Outside the United States the same equation appears in different starting positions. Canada’s liquidity picture remains tighter: nine M&A transactions returned $572 million in Q1 with the exit channel running almost entirely on acquisition activity, and the RTO structure has shifted from exception to de facto pathway. RTO proceeds and M&A exits return capital but rarely at the velocity or scale that normalizes distribution yields and restores new fund commitment appetite. Europe deployed materially more than the USD $4.1 billion in regional fund formation it raised in Q1, with the six USD $1 billion-plus rounds backed by a contracting pool of established GPs rather than a broadening LP base. The pattern is consistent across geographies: existing dry powder and incumbent managers are doing the work, and fresh capital supply lags everywhere.
The defining pattern of Q1 2026 liquidity is asymmetry: record-scale deployment at the very top, constrained formation across the middle, an IPO window interrupted before it could compound, and a DPI gap that has not closed. Whether the exit channels that opened in May 2026 broaden quickly enough to begin restoring LP appetite, and with it the early-stage capital supply that the next generation of companies depends on, is the central variable shaping what 2026 actually delivers.
Looking Ahead
Q1 2026 produced extraordinary headline numbers and a more uncomfortable set of underlying trends. Capital exists. Liquidity exists. Exits exist. None of them are broadly distributed. The question heading into Q2 is not whether AI remains the dominant capital allocation theme; it does, at every stage and every geography. The question is who can access the capital, on what terms, and whether the benefits broaden beyond a small group of AI infrastructure leaders and the funds backing them. If the answer is yes, 2026 marks the beginning of a healthier venture recovery. If the answer is no, 2026 becomes 2025 with larger numbers and fewer participants.
The IPO question is whether SpaceX, OpenAI, and Anthropic trade well enough after debut to reopen the late-stage window for the rest of the backlog, whether their combined scale absorbs the underwriting capacity and institutional allocation that would otherwise serve the next tier of listings (pushing smaller IPOs into 2027), and whether the distributions they generate actually reach the LPs that fund the next generation of emerging managers rather than concentrating with the established managers who hold the largest stakes. If those distributions concentrate at the top, the structural fundraising compression continues even as headline DPI numbers improve. The dependency is no longer circular. It is conditional.
Consumer AI’s entry into healthcare is the other open question of the year. Five major platforms launched health-specific consumer products within a ten-week window in Q1. If two or three of those platforms consolidate as the primary interface between consumers and health information, digital health companies building on top of them inherit the leverage dynamics of the App Store era. The next twelve months will set distribution patterns that may be difficult to renegotiate later.
Closest to home, the early-stage pipeline squeeze is now a multi-quarter problem with mechanical consequences. Canadian Q1 data showed pre-seed and seed at a record 20% share of capital while later-stage activity essentially disappeared. U.S. fund formation compressed to a USD $15 million median as six managers captured three-quarters of new commitments. The companies being seeded now will look for Series A capital in 18 to 24 months into an environment that, absent a meaningful fundraising recovery, will have fewer capable lead investors than the pipeline requires. Early-stage investing is now a long-tailed bet on company outcome and on whether the follow-on capital stack will be there in time.
Europe’s sovereign-capital thesis is the test of whether regional fund formation can outrun regional deployment. Its six USD $1 billion-plus rounds in Q1 spanned AI infrastructure, robotics, autonomous mobility, fintech, and energy, with governments across the region channeling defense commitments toward domestically retained intellectual property. Whether European fund formation scales fast enough to sustain that momentum without depending on U.S. or Asian LP capital determines whether Q1’s breadth becomes a trend or a vintage anomaly.
If 2021 rewarded velocity, and 2023 rewarded survival, 2026 is rewarding scale and specificity. The market is selective rather than closed. Capital flows to companies that have demonstrated that the problem they solve is large, clinically or operationally validated, and difficult to replicate. That is a rigorous environment, not a pessimistic one. Which, for a sector as complex and consequential as healthcare, is probably how it should always have worked.