The Quarterly Checkup: Q2 2025 Market & VC Landscape
Published on September 11, 2025 · Written by Jason Robertson
Market Overview
(In another twist of 2025’s economic plot, a White House tariff gambit briefly stole the spotlight from AI, reminding us that geopolitics can still whipsaw markets even amid a tech frenzy.)
This past quarter reinforced for me that volatility and unpredictability will likely be the modus operandi for the current US Administration, at least until the mid-terms in 2026. This makes forecasting difficult. It also reminds me of a few key axioms to hold in such times: first, I am reminded of Warran Buffett’s quote that “In the short run, the market is a voting machine but in the long run, it is a weighing machine”; second, I remember that everything regresses to the mean. Taken together, I believe that business fundamentals will reassert themselves at some point; however, until then, it’s going to be a bumpy road.
US Macroeconomic Landscape
The second quarter of 2025 started turbulent with a dramatic setback following President Trump's sweeping tariffs announced on April 2 (“Liberation Day”), triggering a sharp crash across global markets, including the U.S. and Canada. However, as the administration softened its stance—pausing for 90 days or rolling back certain tariffs—markets rebounded swiftly. By late May, the S&P 500 had not only recovered but turned positive for the year, and by late June, the S&P 500 and Nasdaq 100 closed at record highs. Global indices joined the rally, with the MSCI EAFE and EM benchmarks each climbing around 12%. By June, U.S. consumer sentiment rose 8.3 points MoM (its first increase since October 2024), a sign that perhaps investors and consumers were able to unclench, take a collective deep breath and say, “Okay, maybe we can live with this.”
From a monetary policy perspective, the U.S. Federal Reserve again held rates at 4.25–4.50%. As a reminder, the independent, non-partisan, non-political, Federal Reserve is tasked with a dual mandate of maximizing employment while managing inflation – the latter a prickly issue today as some economists debate whether the Feds’ long-standing target of 2% is really appropriate versus a slightly higher 3% target. Regardless, while headline inflation may have moderated marginally, with annual CPI at 2.7% YoY in June (vs. 2.8% in March), core CPI landed at 2.9% and increased again in July to 3.1%. This is not surprising and is in-line with most economists’ concerns that the inflationary effects of tariffs will take at least 6 months to truly begin to show in the data. Accordingly, the 10-year Treasury yield hit 4.41%, up 20bps from Q1.
The U.S. economy saw its real GDP grow at a 3.0% annualized pace in Q2, rebounding from a -0.5% contraction in Q1. Unfortunately, this rebound was primarily driven by a sharp decrease in imports – more of an accounting consequence of how GDP is calculated and likely due to the inventory build-up in Q1 ahead of Liberation Day – and many economists feel that this “growth” is a red herring as business investment and exports remained weak. Furthermore, one of the bigger uncertainties around this quarter’s GDP print and the state of the economy is that AI capital expenditures, especially by the Magnificent 7, may have been responsible for almost half of Q2’s GDP growth. Stripping out the AI investments and the one-time adjustment for Liberation Day, the U.S. economy may be on far shakier ground than Wall Street wants to admit. While unemployment held at 4.1% in June – only modestly above the current cycle low of 3.5% in 2022 – it ticked up to 4.2% in July, clouding the picture. In addition, job growth plummeted in June and July with revisions sharply downwards leading to Trump firing the head of the Bureau of Labor Statistics. Payroll growth also slowed but remained positive; however, these figures represent the weakest payroll growth in nearly five years.
Against the backdrop of a very questionable macroeconomic quarter, equities posted very strong gains through most of the quarter. The S&P 500 jumped ~11% in Q2, its strongest quarterly advance since late 2023. The NASDAQ climbed even higher, up ~18. Volatility was elevated early in the quarter (VIX spiked into the 50s in April, an intraday level seen in fewer than 1% of trading days since 1990) before normalizing near its long-run average around 19.5 by early May. This strong rebound has caused US stock valuations to hit a new all-time high, meaningfully exceeding the Dot com bubble of 1999.

I think it is worth pausing here for a moment to explore this chart. Though it may be easy (and correct) to internalize that US stock markets are overheated, a steel man argument against this might be:
1. Interest rates and discount rates are lower (even after the recent hiking cycle) and lower discount rates equals higher justified P/Es and higher equity valuations relative to GDP.
2. Earnings Composition Has Shifted: in 1929, 1965, and even 1999, much of corporate earnings came from industrials, commodities, and financials — cyclical sectors with lower margins. Today, the largest weights in the S&P 500 (Apple, Microsoft, Nvidia, Alphabet, Amazon) have: higher structural margins; recurring revenues; global reach; and, near-monopoly positions in their domains.
3. Corporate profitability and cash flows are structurally higher as a % of GDP and are structurally elevated versus history, partly due to: tax optimization (offshore structures, buybacks); productivity gains from digital platforms and automation; and, oligopolistic concentration in key industries (tech, healthcare, finance).
In sum, AI spending may be masking structural weakness in the economy, tariff inflation hasn’t hit yet, the Fed remains patient, and the US markets are ripping. While bright flashing warning lights may be appropriate, this might not be your father’s Oldsmobile. We might ask ourselves “… is this time truly different?”

In Q2 2025, the venture market followed the pattern of recent quarters, marked by fewer deals, larger check sizes, and heavy dependence on a small number of mega-rounds. In the U.S., dealmaking by pure count held steady: around 4,000 deals were completed but total capital invested fell to $69.9B in Q2, a 24.8% decline in value QoQ (from $91.5B in Q1) but an +11% increase YoY (from $62.9B in Q2 2024). That decline comes with a giant asterisk: Q1’s totals were skewed by OpenAI’s $40B mega-round, the largest VC deal in history, which represented 57% of Q2 value alone. In Q2, Scale AI’s $14.3 billion round accounted for more than 17% of all U.S. venture funding in a single transaction, and became the second-largest VC deal ever; however, this transaction was still >$25 billion smaller than OpenAI’s in Q1 and thus a QoQ dip should be expected. Without these mega-rounds, U.S. totals would look far less robust. That said, H1 2025 U.S. VC reached $161.4B, +38% YoY, which is on pace for one of the strongest years this decade – only this time it’s ultra-concentrated in a few players.
In Q2, late-stage VC saw an intensified flight to quality and scale, with a handful of outsized rounds driving record investment totals in the growth segment. Consider that in H1 2025, $83.9B was deployed just in venture growth-stage deals (Series C and beyond), double H1 2024 and tracking 82% above 2021’s peak. Annualized, that’s nearly $168B, which would far surpass 2021’s peak of ~$92B for late-stage investing. In contrast, early-stage activity (Series A-B) remains sluggish at ~$57B H1, down 19% from H1 2022 highs.


Round sizes also polarized: sub-$5 million financings accounted for just 48.6% of U.S. deal count in H1 2025, the lowest share in a decade, down from 55% in 2024, highlighting how micro-startups are struggling to find backers as capital concentrates into larger bets. The beneficiary of this decline were deals >$50 million. We see the “flight to quality” dynamic play out by dollar flows: Series C and later rounds absorbed $55 billion in Q2, up 53% YoY, while early-stage activity was flat at $26 billion. Seed funding totaled $10.3 billion, but nearly 20% of that came from a single $2 billion raise by Thinking Machines; excluding that outlier, seed activity was flat quarter-over-quarter and down YoY.
Median pre-money valuations climbed to decade highs at almost every stage, especially the very late stage: Series A hit $45.5 million, Series B reached $119 million, and Series C rose to $327.5 million. Series D+ valuations remain the most ambiguous segment of the market in Q2. PitchBook data shows a median of $900.0 million, up from $655.0 million in 2024, reflecting a handful of high-quality, insider-led bridge rounds that cleared at premium prices. However, broader datasets from Carta and CB insights paint a very different picture: late-stage medians remain flat or even down year-over-year as most companies continue to raise structured or down rounds in a still-tight liquidity environment. Seed valuations remained elevated at ~$15.5 million.

Sector concentration remains extreme in venture. Unsurprisingly, AI remains the dominant theme, arguably even more so than in Q1. Roughly 64% of all U.S. venture dollars (~$103B) in H1 2025 went to AI-related companies. (For comparison, even including OpenAI, Q1’s AI share was about 71%, meaning Q2 stayed extremely high on a percentage basis.) This marks an unprecedented sector concentration: more than half of all VC capital is chasing “AI” deals. Of course, the definition of an “AI startup” has grown fuzzy as every company sprinkles a bit of AI into their pitch. In Q2 alone, five AI-centric companies each raised $1B+ rounds, including Scale AI, Safe Superintelligence, Thinking Machine Labs, Anduril, and Grammarly. It’s also worth noting the speed with which new AI players are emerging and scaling: two AI research labs that are barely a year old each raised $2B seed rounds this past quarter, a funding size utterly unheard of at the seed stage until now. Indeed, one of those, Thinking Machines Lab, now holds the record for the largest seed round ever (leading one to question what is the definition of a “seed” financing but that’s a debate for another time). Call it mania, call it conviction: VCs feel AI will transform every industry and they’re pouring in capital at record levels. Outside of pure AI labs, companies in healthcare and biotech followed at $14.8 billion in Q2, with fintech at $10.8 billion.


Female-founded startups continued to face headwinds in Q2. Deal count declined again, and female-founded companies represented just over 21% of U.S. VC deals YTD, down from 23% last year, while all-female teams captured less than 1% of total capital. Aggregate dollars invested reached ~$39B in H1 2025 but much of this was concentrated in a handful of AI-driven megadeals, masking broader fundraising difficulty for most female-led teams.
The exit environment finally showed some traction. Q2 generated $67.7B across 394 exits—the strongest quarter since 2021. Six unicorns went public (including Chime, Hinge Health, Circle, and Voyager) but almost all priced well below their most recent private-market valuation peaks: Chime IPO’d at $9.1B vs a $25B peak (-64%), Hinge at $2.3B vs $6.2B peak (-63%), Circle at $6.4B vs $7.7B (-17%). Down-round IPOs are now the norm as investors clamour for liquidity. Still, Circle’s stock doubled (+117%) post-listing, and Voyager surged 80% on day one, showing selective enthusiasm in US Administration policy-aligned sectors (crypto, defense tech).


One positive development is on the M&A front. M&A activity has risen for two consecutive quarters, approaching the peak levels of 2021 in aggregate value. M&A added $32.2B across 229 deals. In Q1, we saw the largest venture-backed acquisition ever announced (Google’s $32B bid for cybersecurity firm Wiz), and Q2 continued the trend with multiple $1B+ buyouts. This uptick in M&A, call it a mini “exit relief” if you will, is helping to offset the slow IPO market. Yet venture-backed IPO volume is still running at less than one-third of pre-2021 averages, and many late-stage companies continue to defer listings into 2026.


On the fund side, U.S. VC fundraising remains deeply challenged. H1 2025 saw the fewest fund closes and lowest dollar volume in nearly a decade, just $26.6B raised across 238 funds (-34% YoY). Median time to close has stretched to a record 15.3 months as LPs remain cautious amid weak DPI and illiquidity. Emerging managers are bearing the brunt: first-time funds raised only $1.8B in H1, on track for their lowest total in over ten years. Established firms with strong track records continue to attract the lion’s share of capital, widening the gap between incumbents and new entrants.
Churning beneath the seeming frothy surface of this ecosystem is liquidity (see what I did there?). Liquidity remains the critical pressure point, with venture distribution yields well below long-term averages, limiting LP recycling into new funds. While IPO activity tentatively restarted in Q2, it is not yet a reliable liquidity channel. Furthermore, this IPO activity hides a dirty little secret in venture: VCs don’t liquidate their public holdings right away.
As a VC (and an LP into VC funds), I was raised with the belief that it is not our role as GPs to manage public equities but rather to sell – or transfer – our positions as soon as practicable and let our investors (LPs) decide how they wish to invest their distributions. Those LPs could then choose to invest back into that – now public – business should they wish or invest elsewhere. Interestingly, there has been meaningful historical research into this (circa 2000-2015) but literature in the last ten years has been sparse. A study in 2000 analyzing over 3,200 lock-up agreements found that in the year following an IPO, venture capitalists sell or distribute 29% of their stake, with the median at 17%. This includes both market sales and distributions to their limited partners. Perhaps the most relevant was a study in The Journal of Financial Research in 2024 that showed VCs typically retain their shares for around three years after the IPO. However, liquidity pressures and strong post-IPO performance can accelerate exits. There are likely many reasons for this delay in liquidation post-IPO. On the positive side: VCs may have better knowledge and insight into the company and anticipate further upside potential without incurring the tax consequences of selling for their LPs (and similarly want to generate better DPI or IRR returns for fundraising); VCs holding may be a confidence signal; and, VCs may remain on the Board and thus want to maintain good relations and not incur the reputational risk of selling immediately and “abandoning” the venture. On the negative side: VCs are not public equity managers; and, management fees continue to be charged on these holdings causing a potential misalignment of incentives with LPs. Regardless of the reasons, the data is clear: a reopening of the IPO window will still require 2-3 years for that liquidity to recirculate in the venture ecosystem.
Meanwhile, the secondary market continues to serve as an essential release valve, though pricing remains below par with average discounts of 20–30% to the last round. U.S. direct secondaries are now an estimated $60–65B annually, modest compared to total unicorn equity (~$3.2T) and roughly on par with Q2’s primary exit value of $67.7B. Secondary trading remains highly concentrated: in Q1, just 20 startups accounted for over 83% of secondary transaction volume (the top five alone >50%). Still, what was once a last resort is becoming mainstream. Secondary dry powder has doubled in three years, now at ~$25B, and tender offers are increasingly common, giving founders and early backers a way to realize partial liquidity without an IPO.
In short: while the macro picture may be more uncertain than ever, Q2 felt calmer in the startup world as VCs calibrate to the new normal. After nearly 18 months of dormancy, the IPO window is not wide open, but at least it is no longer sealed shut. Inflation may be drifting down, the Fed is on hold but may soften its position, equities are strong, and liquidity paths are slowly broadening. But capital is still clustered at the top, and most venture-backed companies remain on the sidelines waiting for the real exits to come back.
Global Venture Capital Landscape
Zooming out globally, venture funding mirrored the U.S. pattern: more capital concentrated into fewer deals. Q2 2025 saw $91B in global VC funding, down from the $114B in Q1 (and -3% YoY). That made Q1 the highest quarter for global funding since late 2022, thanks largely to the OpenAI deal. H1 2025 global funding hit $205B (+32% YoY) vs. H1 2024, on pace for the best year since 2021; however, over a third of that capital ($70B) went into just 11 mega-rounds of $1B or more. Two mega-deals (OpenAI $40B, Scale AI $14.3B) accounted for 26% of all H1 global VC dollars, which helps explain why roughly two-thirds of global VC funding in Q2 went to U.S. companies. In Q2 specifically, nearly one-third of all global VC dollars went to a mere 16 companies that raised $500M+ rounds. It’s a staggering concentration of capital at the top. North America’s share of the global pie has jumped, while Europe and Asia saw relatively flat or declining activity in most categories.
All the growth in global VC this quarter came from late-stage activity as well. Worldwide late-stage (Series C+) funding hit ~$55B in Q2, up more than 53% YoY (though down from Q1’s peak), as big money chased mature companies. Early-stage funding, by contrast, was flat QoQ at about $26B globally, and actually down from a year ago (-8% YoY; Q2 2024 had an unusual pipeline of huge Series Bs in AI). Seed-stage investment globally ticked up to ~$10B, but that was entirely due to the anomalous $2B seed mentioned earlier; excluding that one deal, seed funding would have been roughly flat QoQ and down 12% YoY. The top of the funnel is not expanding and, in many ecosystems, it’s contracting. This raises long-term questions: if fewer new startups are geting funded, what will the innovation pipeline look like a few years from now? It’s a concern I noted last quarter and continues to keep me up at night.
Regional concentration is also evident: the U.S. captured approximately $60 billion, or two-thirds of global VC, while North America as a whole drew 70% of H1 totals. Europe saw mixed results, with Germany surpassing the UK as the top VC destination for the first time in over a decade, helped by large rounds such as Helsing’s $694 million raise. In Asia, funding was $12.8 billion, with China subdued and India down from its 2021 highs. Latin America was led by Mexico, which for the first time since 2012 surpassed Brazil in venture dollars raised.
In short, Q2 global venture data shows dollars up, deals down, valuations rising, and exits thawing but not yet flowing. The “big get bigger” theme is stronger than ever, with AI at the center of gravity.
US Digital Health Landscape

Amid this broader venture landscape, the digital health sector had a noteworthy first half of 2025. H1 2025 saw about $6.4B invested into U.S. digital health startups across 245 deals. That’s up slightly from $6.0B (273 deals) in H1 2024 (+13% YoY). Q2 alone contributed $3.4B and 123 deals of that funding, making it one of the strongest digital health quarters in the past two years (the average quarter since early 2023 was around $2.6B), a 31% jump vs. Q1 ($2.6B). Deal volume, however, remains on the lower side. If the current pace continues, 2025 could see the lowest deal count for digital health since 2020. Fewer deals, but larger average checks: the average deal size in H1 hit $26.1M, up significantly from ~$20M in 2024, a theme consistent with the broader venture market. Early-stage seed activity in digital health is still muted but growth-stage committments are back. In Q1, we noted a resurgence of big late-stage rounds (e.g. Innovaccer’s $275M Series F, Abridge’s $250M Series D) and Q2 continued that selective comeback of mega-rounds, as we’ll note in a moment.

It cannot be overstated how much AI has invigorated digital health. For the first time ever, AI-enabled startups captured a majority (62%) of digital health funding in the first half of the year. Essentially, investors are pouring money into health tech companies that use AI, from clinical decision support to drug discovery to administrative automation (as an aside, at Nimbus we’ve been investing in this ML/AI theme since our founding with many of our portfolio companies AI-enabled even before it was “cool”). These AI-enabled health startups are raising much bigger rounds on average: $34.4M per round, an 83% premium over the ~$18.8M average for their non-AI counterparts. That was evident even at earlier stages: the average Series A for an AI-enabled health company in H1 was ~$24.4M (vs ~$15.6M for non-AI), and average Series B was ~$54.8M (vs ~$39.6M non-AI). The top three value propositions by funding were non-clinical workflow tools ($1.9B), clinical workflow tools ($1.9B), and health data infrastructure ($893M). Together those drew 55% of all digital health funding in H1. It’s no coincidence that all three areas are being transformed by AI and automation: investors are betting on the “picks and shovels” of an AI-enabled healthcare system (workflow optimization, data plumbing, etc.).
By therapeutic area, oncology and mental health led investments in H1, attracting $1.1 billion and $730 million respectively. The largest single deal of Q2 was Neuralink’s $650 million raise, though the headline deals also included Abridge’s back-to-back $100 million-plus rounds in AI clinical documentation.
With bigger rounds returning, mega-deals (>$100M) have reappeared. H1 2025 saw 11 mega-rounds in U.S. digital health, putting the year on track to surpass 2024’s total of 17 such rounds. Nine of those 11 went to AI-driven companies. As noted earlier, Abridge, an ambient clinical documentation startup, raised two mega-rounds in just a four-month span. Another is OpenEvidence, an AI-native medical search platform, which, after raising a $75M Series A in February, closed a $210M Series B in July, reaching unicorn status.
Why such confidence? Part of the answer lies in real-world traction. Healthcare, notoriously a slow adopter of tech, is embracing certain AI-enabled solutions at a pace we’ve never seen before. Ambient clinical documentation tools (which automatically transcribe and summarize doctor-patient conversations) are seeing adoption rates on the order of 30–40% of physicians nationally, with some leading health systems reporting up to 90% utilization of these tools, all within a couple of years of introduction. This is the fastest uptake of any new technology in healthcare history. Such stats were unimaginable a few years ago.
Two companies in particular are poster-children of this new momentum. Abridge has its AI “medical scribe” deployed in 100+ U.S. health systems and recently became the first “native” AI partner integrated into Epic’s EHR workflow. That kind of deep integration was historically a major barrier for startups and Abridge’s progress shows how a clear ROI (saving physicians time) can overcome entrenched enterprise friction. OpenEvidence hit 100,000 clinician users faster than any platform in recent memory and is adding ~50,000 new doctor-users each month. Its chat-style AI search fits into how clinicians seek information and its growth reflects a demand for better clinical knowledge tools. It is a bit remarkable that after years of hesitancy, healthcare incumbents are also embracing startups proactively (i.e. big providers partnering with tech upstarts, pharma companies co-developing digital solutions, and payors investing in health tech).
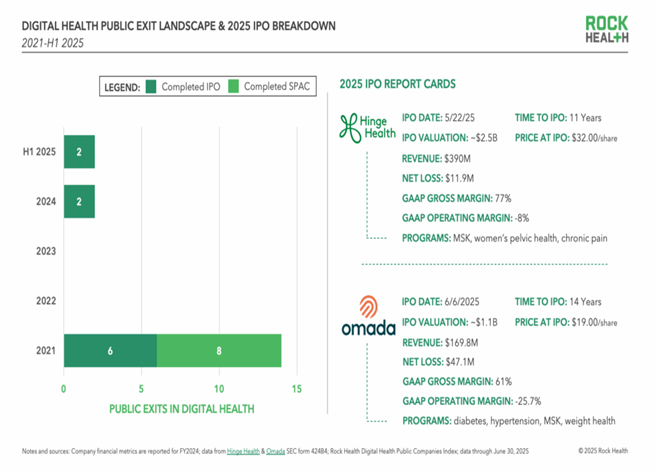
On the exit side for digital health, it has been scarce. Until recently, digital health IPOs were nonexistent. Only two digital health companies went public in the past three years (Cerebral in 2022, Tempus in 2023). But in Q2, Hinge Health, a well-known digital physical therapy platform, launched its IPO on the NYSE at a ~$2.3B market cap, down from its $6.2B private peak (–63%), but still one of the sector’s largest new listings in years, and traded up ~18% on day one. Hinge’s successful debut (although at a valuation below its last private round) is an encouraging sign. Around the same time, Omada Health, a chronic care management leader, completed its IPO in early June 2025, raising approximately $150 million at $19 per share and achieving an opening market capitalization of about $1.1 billion. Alongside Hinge Health, Omada’s debut helped reignite interest in digital health IPOs, though keep caution that only a few well-prepared companies are ready to follow suit in the near term.” Meanwhile, M&A in digital health continues in a “tapestry” fashion: many smaller tuck-in acquisitions and a lot of startups acquiring other startups (as we highlighted in Q1, a majority of health tech M&A deals are now startup-to-startup). The fact that we’re discussing IPOs again is itself a relief. That said, sustainability is the key question: one or two quarters of heavy AI-fueled investment is great, but the sector will need to show results to keep this upturn going in a choppy economy. For now, we like what we see: cautious optimism is justified.
Canadian VC Landscape


Turning to Canada, Canadian VC stayed resilient in dollars, weaker in volume. Q2 saw about $1.65B invested across 131 Canadian VC deals (vs $3.1B and 310 deals in H1 2024), bringing H1 2025 to roughly $2.9B over 254 deals – that is roughly on par with the first halves of 2023 and 2024. By full-year 2024, Canadian VC value totaled ~$4.1B and 2025 is currently only ~30% shy of that in the first half, perhaps putting us on pace to approach or even surpass last year’s total if momentum continues.
However, dig deeper and you see the familiar signs of a crumbling foundation: volume declines and top-heavy activity. The average deal size in Canada jumped to $12.6M in Q2, up 24% QoQ, and roughly in line with recent historical averages but the number of deals has fallen well below the mean: Canada closed 254 deals in H1, whereas the five-year average for the same period would be ~346 deals (down 27%). Q1’s 116 deals and Q2’s 131 deals are some of the slowest quarters Canada has seen in recent memory.
This “fewer but larger” dynamic is very much in play in Canada too – just eight mega-deals (>$50M) occurred in H1 2025, totaling ~$1.4B. Those big deals accounted for 50% of all VC dollars invested in Canada so far this year. This is actually a double-edged sword: on one hand, it’s good to see that Canada can still produce (or attract) large rounds for scale-up companies; on the other hand, eight mega-deals is the lowest first-half count since 2017, implying that outside of a few headline-grabbing fundings, the rest of the market has been relatively soft. For comparison, during the 2021 peak, Canada had multiple $50M+ deals by mid-year.
It’s also instructive to look at what those largest deals were in H1. Interestingly, the two largest “funding” events in Canada in 2025 so far were not traditional primary VC rounds, they were secondary transactions. In Q2, Jane Software (a Vancouver-based health tech company) completed a $500M secondary led by a growth equity firm, allowing early investors to sell shares. And in Q1, StackAdapt (a Toronto-based adtech firm) did a $337M secondary sale to institutional investors. Together, those two secondary deals sum to $837M, which alone is ~30% of all Canadian venture dollars so far this year (CVCA notes that these transactions provided liquidity to early backers and indeed, they count toward exit value in their report; CVCA pegs the combined value at $919M, slightly above the $837M tally). In terms of exits overall, Canada saw 20 in H1 totaling $1.1B, and tellingly, $919M (84%) of that exit value came from those two secondary deals. In contrast, classic M&A exits were modest: only 14 M&A exits were recorded, totaling about $171M (and no IPOs). We are now two full years without a Canadian VC-backed company going public and the ones that did exit via acquisition were mostly small undisclosed deals. Liquidity is trickling in, but not enough to reset LP confidence or to replenish funds at the pace we need.
The dynamics within funding stages highlights the severe capital crunch in Canada: pre-seed remained the smallest slice of the market in H1 2025, with just 47 deals totaling $39M (avg. $0.8M), roughly 30% below historical averages. Seed was similarly muted at $258M across 86 deals (avg. $3M), also down ~30% from five-year averages. Early stage (Series A/B) absorbed $908M across 68 deals, a 47% YoY decline and the weakest performance relative to historical averages. Later stage activity totaled $737M across 24 deals, down 34% YoY, despite marquee financings like Tailscale’s $230M Series C helping prop up dollar totals. Fewer companies are breaking through to larger rounds, and capital is concentrating in a narrow set of scale-ups while the broader base contracts.
Stepping back and despite headline numbers that might suggest otherwise, the Canadian VC ecosystem continued weaking in Q2 2025, especially in the earliest stages. We remain badly in need of replenishment at the top-of-the-funnel: fewer new startups are getting funded, which will lead to a “missing generation” of Canadian startups in the coming years if the trend isn’t reversed quickly. This was a concern I voiced last quarter, and it is what keeps me up at night: Canada’s innovation economy tomorrow depends on seeding startups today.


Sector-wise, the ICT sector (software, ICT, etc.) led in total dollars with about $1.39B across 115 deals (roughly 40% of all investment), but this was only ~30% of ICT’s total from H1 2024, a sharp drop, indicating the tech sector cooled significantly from last year’s levels. Meanwhile, Life Sciences surged to $894M across 58 deals: that’s only a ~$497M gap behind ICT, the smallest gap on record between Canada’s first- and second-largest sectors. In fact, Life Sciences investment is one of the few areas that remained above historical averages, even as other sectors fell. This aligns with what we’re seeing on the ground - strong companies in biotech, healthtech, and medtech continue to attract capital. Cleantech (-71% YoY, $191M across 24 deals) and agtech ($31M across 14 deals) were the next largest sectors but both saw big declines compared to 2024 (cleantech in particular was only ~17% of its prior-year H1 level, after several big climate-tech deals in 2022-23 failed to repeat).

Geographically, Canadian VC remains highly concentrated in a few hubs, even more so than before. Ontario, Quebec, and BC accounted for 84% of all dollars and 76% of all deals in H1. Ontario alone was 40% of deal count and ~$1.2B (40%) of funding. Quebec saw about $524M (18%) of funding and had the second-highest deal count at 60 deals (24%). BC interestingly ranked second in total dollars with ~$737M (25%), but that comes with a caveat: a big chunk of BC’s funding was Jane’s secondary transaction. BC also boasted the highest average deal size of any province at ~$23.8M – again though, an outlier figure directly attributed to the $500M Jane deal inflating the stats. Alberta had a decent showing in deal activity (37 deals, 15% of the count) but a much smaller share of dollars ($279M, under 10%) as most deals were early-stage or mid-sized; however, removing Jane, BC and Alberta were on par. Outside the major 3-4 provinces, the numbers drop off precipitously e.g. Nova Scotia, Manitoba, Saskatchewan each saw only a handful of deals (though Manitoba did have one large Series B: Conquest Planning’s $110M round). One positive note is that U.S. and international investors remain active in Canada, especially for bigger rounds. In H1, U.S. VCs participated in about 50% of all Canadian mega-deals, and while overall U.S. participation in Canadian deals is down slightly from last year (by count), cross-border co-investment is still a major feature of our ecosystem. This foreign interest provides capital and validation for Canadian startups, but it also means our best companies often get courted to relocate or primarily serve U.S. markets.
The exit landscape in Canada only aggravates this burgeoning catastrophe: with virtually no IPOs and only modest M&A, Canadian VCs aren’t seeing cash returned from past investments. That keeps them defensive – focusing on inside rounds, bridge fundings, and extending runways for portfolio companies rather than aggressively hunting new deals. It also makes LPs more hesitant to commit new capital, slowing down fundraises for Canadian VC funds (some of which are approaching their own fundraising cycles without the usual DPI to show). As a result, we see many Canadian firms slowing their investment pace, preserving capital for follow-ons, and being extremely picky with new investments. Nimbus may be an exception: our evergreen structure allows us to continually invest without being beholden to fund lifecycles. That said, given the macro environment, we are maintaining our high bar for conviction and quality for new opportunities and the deals we are pursuing tend to be ones where we have strong domain expertise and where the company has a clear line of sight to milestones that can weather economic uncertainty.
Despite these challenges, we remain optimistic: Canada continues to produce world-class innovation in AI and health/life sciences, areas where we have deep talent pools. The current market dynamics are forcing everyone to be more disciplined, which isn’t entirely bad: companies are focusing on fundamentals and investors are pricing deals more reasonably. When the broader macro clouds (trade tensions, rate uncertainty, etc.) eventually part, we expect a healthier, more sustainable growth environment to emerge. What would help in the near term? A few catalysts could really lift sentiment: clarity or resolution on U.S.-China trade policy (so Canadian tech companies and their acquirers can plan without tariff overhangs), one or two home-run exits (an IPO of a Canadian unicorn, or a major acquisition that returns significant capital to Canadian funds), and continued support from policymakers to spur domestic innovation and venture funding. Organizations like the CVCA are actively advocating for measures to unlock more Canadian capital and attract global investors – those efforts are important, especially during slower periods like this.
In summary, Q2 2025 was a mix of encouraging signals and lingering caution. The macro environment dealt some surprises and the venture ecosystem adapted with a focus on quality and long-term plays. Globally and in Canada, venture investment is heavily skewed to the winners: AI being the clearest winner of all while younger startups fight harder for attention. Digital health showed that even in a tough climate, a compelling value proposition (often bolstered by AI) can secure funding and even an IPO, which gives us hope. Canada’s numbers reflect stability on the surface, but with undercurrents of selectivity and concentration that we’re navigating carefully. At Nimbus, we are maintaining a conversational yet vigilant outlook: excited about the technologies and entrepreneurs we see pushing the envelope (there’s plenty to be excited about), but also realistic that the market’s full resurgence will take more time and patience. For now, we’ll celebrate the wins – a new partnership, a milestone trial result, a timely follow-on round, and continue to back the innovators who are building the future of health and technology. Q2 provided some proof in the pudding that innovation is still getting funded and even rewarded; in Q3 and beyond, we’ll be looking for more of those proof points to cumulatively signal that the market is truly turning the corner.