The Quarterly Checkup: Q4 2025 Market & VC Landscape
Published on March 19, 2026 · Written by Jason Robertson
Market Overview
2025 ended in a place that would have felt unlikely a year earlier: major stock indices approached record highs, volatility remained subdued, and investors were buying risk rather than hiding in cash, even after a year that included new tariffs, bigger government spending, and plenty of political noise.
Coming out of Q3, markets had already begun to settle down: interest rates were coming down; inflation was closer to the Fed’s target; and, investors had adjusted to the idea that borrowing money costs more than it did in the zero-rate years, and that this is the new normal. Q4 introduced little new direction; it simply confirmed that markets could remain stable despite messy data and political dysfunction.
The first half of 2025 forced markets to reset expectations. New tariffs and expanded fiscal spending raised questions about growth and inflation but by midyear, investors came to believe that the Federal Reserve was finished raising rates and had started slowly cutting them instead. That shift matters because it lowers borrowing costs over time and supports asset valuations. In Q3, market conditions improved: borrowing became slightly easier, large companies were able to raise money again, and volatility faded. By Q4, investors were acting as if lower rates, and strong earnings from AI-related companies, were not temporary boosts like previous times, but trends that could continue.
The most noticeable part of Q4 wasn’t explosive growth, rather, it was what markets chose to ignore. The longest ever government shutdown? Absorbed. Rising deficits? Ignored. Sticky services inflation? Whatever. The one thing investors were not willing to miss though was the surge in spending tied to AI infrastructure: the five largest U.S. cloud and AI and infrastructure providers – Microsoft, Alphabet, Amazon, Meta, and Oracle – spent approximately US$380B on capex in 2025. Those same five have now forecast spending almost US$700B on capex in 2026, almost double the prior year. As a result, companies tied to semiconductors, data centers, and cloud infrastructure drove most of the market’s gains. A few other sectors improved toward year-end, but overall performance was still heavily dependent on a small group of very large firms.
Markets don’t need everything to look perfect right now. They just need those key companies to keep delivering strong profits. As long as earnings tied to AI spending remain solid, the broader market holds up. It’s a stable environment, but one that relies on a fairly small number of drivers.
U.S. Macroeconomic Landscape
The U.S. macroeconomic backdrop in Q4 2025 was less about a single shock and more about layered policy collisions. Fiscal expansion, institutional disruption, and monetary recalibration all unfolded within a few months of each other, and somehow asset prices kept climbing. The sequence of events matters because each layer altered the policy transmission mechanism in real time.
The fiscal year began with the implementation of the One Big Beautiful Bill Act (OBBBA), signed into law on July 4. The US$3.4 trillion package functioned as a large-scale fiscal and tax reform stimulus, with implications for the venture ecosystem. Most directly, the expansion of the Qualified Small Business Stock (QSBS) exclusion, which raised the shielded gain to the greater of US$15 million or 10x basis, should improve after-tax venture returns. The retroactive restoration of 100% R&D expensing reversed the five-year amortization requirement introduced under prior tax reform, directly benefiting startups with heavy research cost structures. For early-stage companies, this improved cash flow timing; for investors, it increased net return potential. Few policy changes receive bipartisan applause from founders and tax accountants, but this one came close.
However, this fiscal generosity came with deficit consequences: Moody’s downgraded the U.S.’ credit rating from AAA to Aa1, citing the structural impact of rising federal debt. By November 2025, federal spending for the first 11 months of the year reached US$7.6 trillion, US$248 billion higher than in 2024. At the same time, the Department of Government Efficiency (DOGE), led by Elon Musk, oversaw a 9% reduction in the federal workforce, eliminating approximately 271,000 jobs in under ten months, including 150,000 in October alone. While the workforce reduction was dramatic, its fiscal impact was not. Entitlement spending and debt servicing costs continue to dominate the budget profile and they do not respond quickly to administrative downsizing.
The fiscal expansion was then followed by a 43-day federal government shutdown running from October 1 to November 12, the longest in modern U.S. history. Roughly 900,000 federal employees were furloughed and approximately two million were required to work without pay. Bloomberg Economics estimated the shutdown cost the economy US$100 billion, translating to approximately a 1.3 percentage point drag on Q4 real GDP growth. Other estimates suggest output losses of roughly US$11 billion in direct foregone activity, with GDP shaved by approximately 0.25 percentage points for every week the government remained closed. Regardless of methodology, the economic effect was measurable.
More important was the shutdown’s impact on data integrity. The Bureau of Labor Statistics did not collect household survey data in October 2025, meaning Q4 household survey data were not produced. The Bureau of Economic Analysis cancelled the advance Q3 GDP estimate and rescheduled the advance Q4 2025 GDP release to February 20, 2026 due to insufficient source data. The result was a statistical blackout during a period of active monetary recalibration. This is not a minor technical issue: when official labor, inflation, and housing data are delayed, markets substitute private indicators, volatility increases around releases, and the Federal Reserve must lean more heavily on incomplete or “soft” data. Monetary policy is already forward-looking – now it becomes even more path-dependent, increasing the risk of overshoot before corrections can be made.
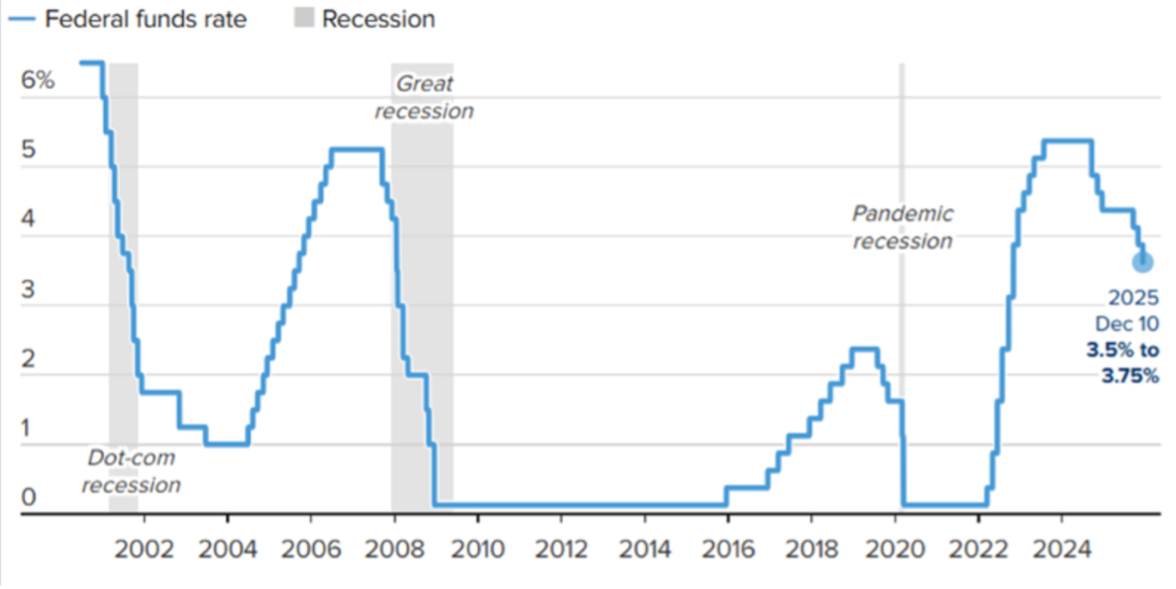
Monetary policy responded in stages. After cutting rates in September to 4.00%-4.25%, the Federal Open Market Committee lowered the federal funds target range again on October 29 to 3.75%-4.00% and signalled the conclusion of balance sheet reduction starting December 1, effectively ending quantitative tightening. On December 10, citing downside employment risks and inflation that remained “somewhat elevated,” the Fed cut another 25 basis points to 3.50%-3.75%. It further indicated that it would initiate purchases of shorter-term Treasuries as needed to maintain ample reserves. Ending QT and emphasizing reserve management signalled a shift toward liquidity preservation. In practical terms, the Fed moved from a restrictive bias to a stabilization bias.
Inflation closed the year near target but remained complex. Headline CPI rose 2.7% YoY in December, matching November’s pace. Core CPI printed at 2.6% in some measures and 3.1% in others, reflecting stickiness in services categories. Some of that stickiness likely reflected lag effects from April tariff adjustments and ongoing wage pressures. For policymakers, the implication was straightforward: progress was sufficient to justify cuts but not sufficient to accelerate them. For sectors like healthcare, services inflation transmits directly through wages and utilization, sustaining cost pressure even as goods inflation moderates.
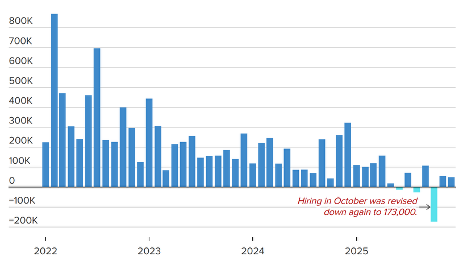
Image 2.1. Monthly Job Creation in the U.S (Jan 2022 – Dec 2025)
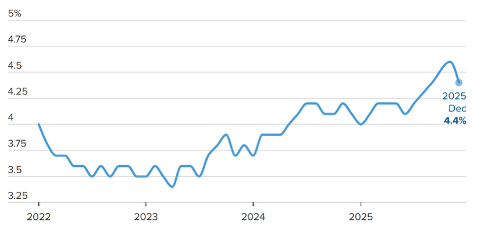
Image 2.2. Unemployment Rate in the U.S (Jan 2022 – Dec 2025)
Labor markets softened but did not collapse. December payrolls increased by 50,000, marking one of the weakest monthly gains since early 2023. The unemployment rate rose to roughly 4.4%-4.5% by year-end, with approximately 7.5 million unemployed. Long-term unemployment increased to 1.9 million, up 397,000 YoY, while part-time employment for economic reasons rose to 5.3 million, up 980,000 YoY. Total payroll growth for 2025 was 584,000 (approximately 49,000 per month), sharply down from 2.0 million in 2024. The pattern is consistent with cooling labor demand rather than a recessionary contraction: fewer hires, limited layoffs, and growing underemployment.
Consumer spending though remained somewhat firm. Real personal consumption expenditures increased at an estimated annualized rate of 2.4% in Q4. The most plausible explanation remains the wealth effect. Equity markets finished the year near highs, and high-income households, who hold the majority of financial assets and account for a disproportionate share of consumption, continued to spend. However, lower-income groups began feeling the impact of new caps on Parent PLUS loans and the expiration of certain student loan repayment plans, creating divergence within the consumption base.
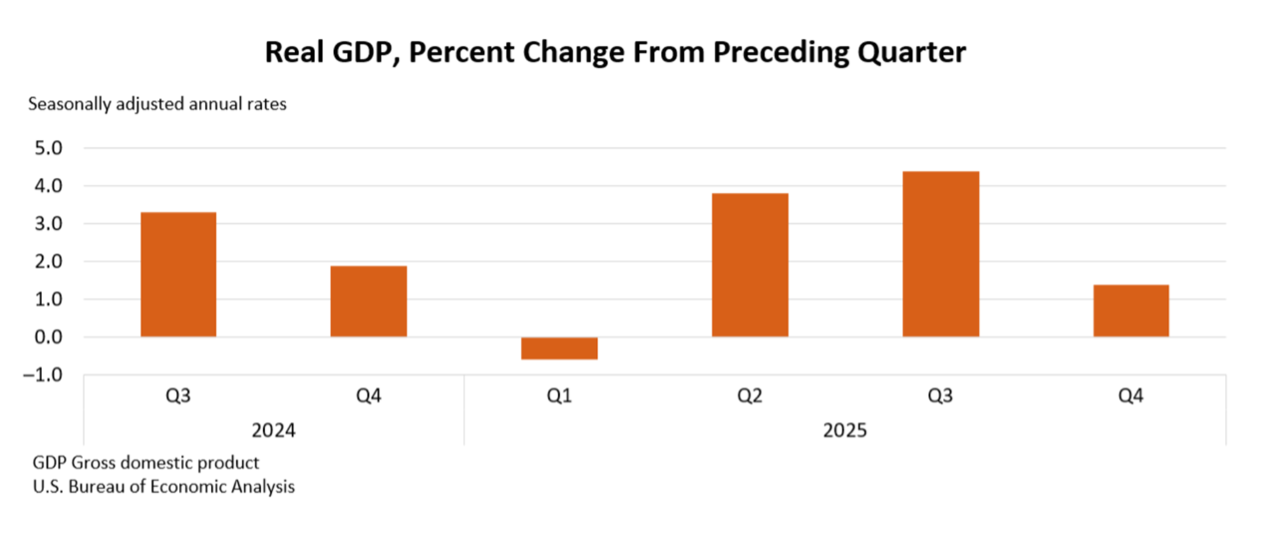
GDP data remain partially obscured by timing distortions. The last confirmed print shows Q3 2025 real GDP growing at an annualized 4.4%, driven by consumer spending, exports, government outlays, and private investment. Q4 estimates vary significantly due to shutdown-related disruptions. Bloomberg places Q4 growth between 0.5% and 1.1%, reflecting the shutdown drag. In contrast, the Federal Reserve Bank of Atlanta’s GDPNow model estimated Q4 growth at approximately 5.4% annualized in late January. The range is unusually wide, highlighting model dispersion during data uncertainty. The range itself is instructive: the economy’s late-2025 profile was sufficiently resilient to sustain risk appetite, but headline prints remain highly sensitive to measurement gaps.
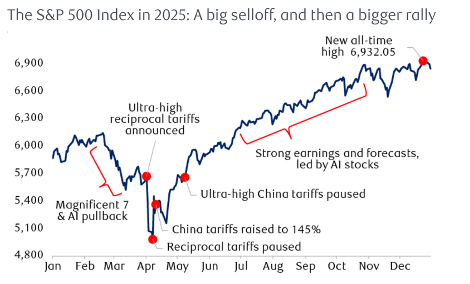
Public markets chose to focus on liquidity rather than dysfunction. The S&P 500 returned approximately +2.7% in Q4, bringing full-year 2025 total returns to roughly +17.9%. The Nasdaq 100 outperformed at +21.24% for the year, driven primarily by AI-related equities. The Russell 2000 gained 12.81% in 2025, a recovery as interest rates declined and investors broadened exposure beyond large-cap technology. International equities outperformed in Q4: the MSCI EAFE Index rose approximately +4.9%, MSCI Emerging Markets increased +4.8% (USD total return), and Canada’s S&P/TSX Composite gained approximately +6.3%. The 10-year Treasury yield ended the year at 4.18%, down from peaks near 4.6% earlier in the year, reflecting expectations of a cautious easing cycle.
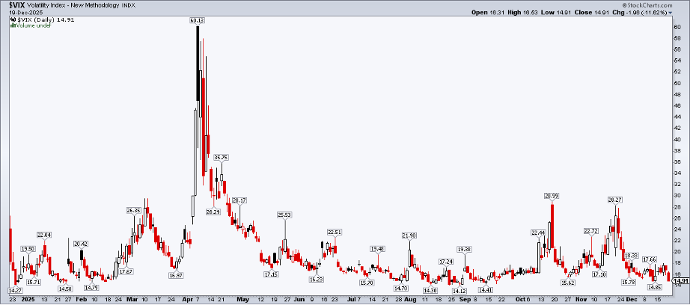
Volatility remained episodic rather than systemic. Average VIX levels in Q4 were approximately 15% higher than in Q3, peaking at 26.42 on November 20 and falling to 13.47 by December 24. This pattern suggests volatility was event-driven, linked to policy uncertainty and shutdown headlines, rather than indicative of structural financial stress.
Q4 2025 reflects a macro environment defined by fiscal expansion, institutional disruption, monetary easing, labor cooling, and resilient consumption. The Federal Reserve’s rate cuts and termination of QT supported liquidity conditions even as inflation remained moderately above target. The shutdown impaired data quality and complicated policy calibration, increasing uncertainty bands around growth estimates. Yet asset markets finished the year strong, driven by easing expectations, AI-led equity momentum, and durable high-income consumption. The result is a late-cycle profile characterized by slowing labor growth, contained but persistent services inflation, elevated fiscal deficits, and a central bank prioritizing liquidity stability over restrictive discipline.
US Venture Capital Landscape
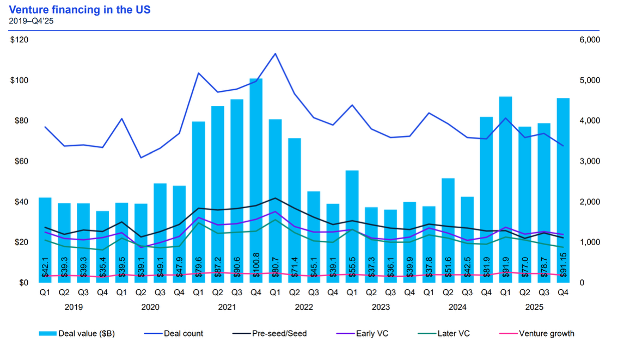
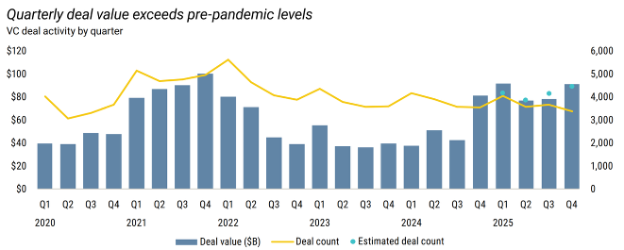
The U.S. venture market in Q4 2025 closed the year with strong headline deployment figures, but the underlying structure remains highly concentrated. Q4 deployment came in at US$91.6 billion across 4,482 deals, a number that looks healthy in isolation and even reassuring compared to the post-2021 drawdown. However, while dollars stayed elevated, breadth did not return. Capital is clearly available – it is simply not available to everyone.
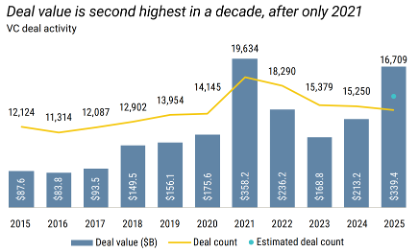
For full-year 2025, U.S. venture investment reached approximately US$339.4 billion, the highest level in four years and only modestly below the 2021 record. On a dollar basis, the market appears recovered. On a distribution basis, it has not.
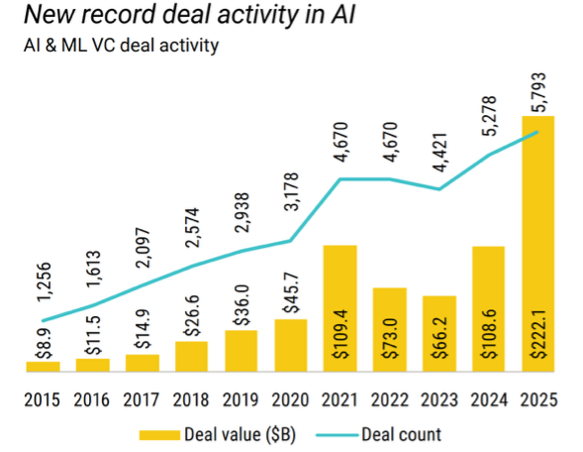
The primary driver of this market skew is artificial intelligence. According to PitchBook, AI/ML companies captured 65.4% of total U.S. VC deal value in 2025, approximately US$222 billion out of US$339 billion. This is a dramatic shift from 47.2% in 2024 and just 10% in 2015. AI is no longer just a hot sector; it is the capital allocation framework through which venture dollars are being filtered. If a company fits inside that narrative, it competes in one market. If it does not, it competes in another.
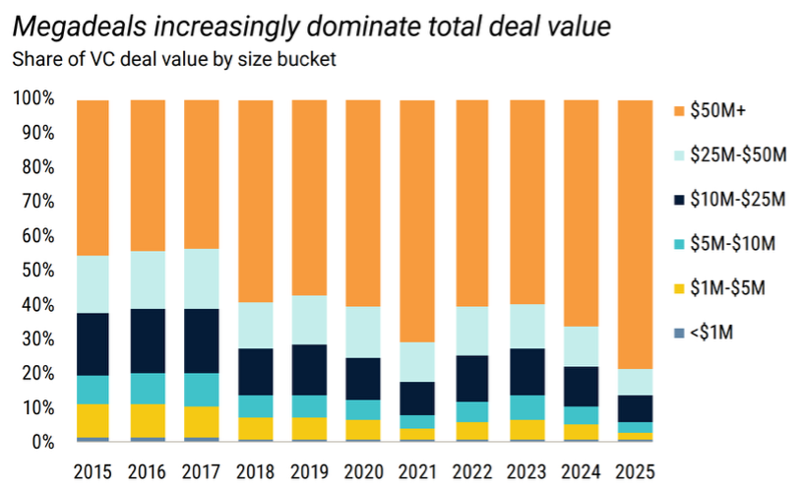
Q4 made this dynamic difficult to ignore. The top eight largest deals in the quarter accounted for over US$32 billion in investment, led by Anthropic’s US$15 billion round, and were all AI-related. Other major financings included “Project Prometheus” at US$6.2 billion, Anysphere at US$2.3 billion, and Reflection AI at US$2.0 billion. In total, 41% of Q4’s US$91.6 billion in deployment, US$37.4 billion, came from just 11 transactions, each >US$1 billion. When fewer than a dozen rounds account for nearly half of quarterly capital, averages begin to tell a different story than medians. This level of concentration skews quarterly averages and masks the tighter environment faced by the broader startup population. Project Prometheus illustrates the magnitude shift. Founded less than a year prior, with Jeff Bezos as a co-founder and investor, the company raised a US$6.2 billion early-stage round. That single transaction drove quarterly first-time financing totals to US$12.8 billion, a figure that in prior cycles would represent annual funding for entire subsectors. The scale of early-stage AI financings is redefining historical benchmarks for what constitutes a “growth” round.
This reinforces the barbell dynamic identified in Q3. In Q3, U.S. venture deployment was approximately US$80.9 billion across ~4,208 deals, already skewed by mega-financings. In Q4, dollars increased while deal counts remained relatively stable. That suggests baseline early- and mid-stage activity continues, but incremental capital is flowing disproportionately to a narrow set of perceived category leaders. The market is not broadly “risk on” in the sense of widespread experimentation; it is selectively aggressive in backing companies expected to define infrastructure layers of the next computing cycle.
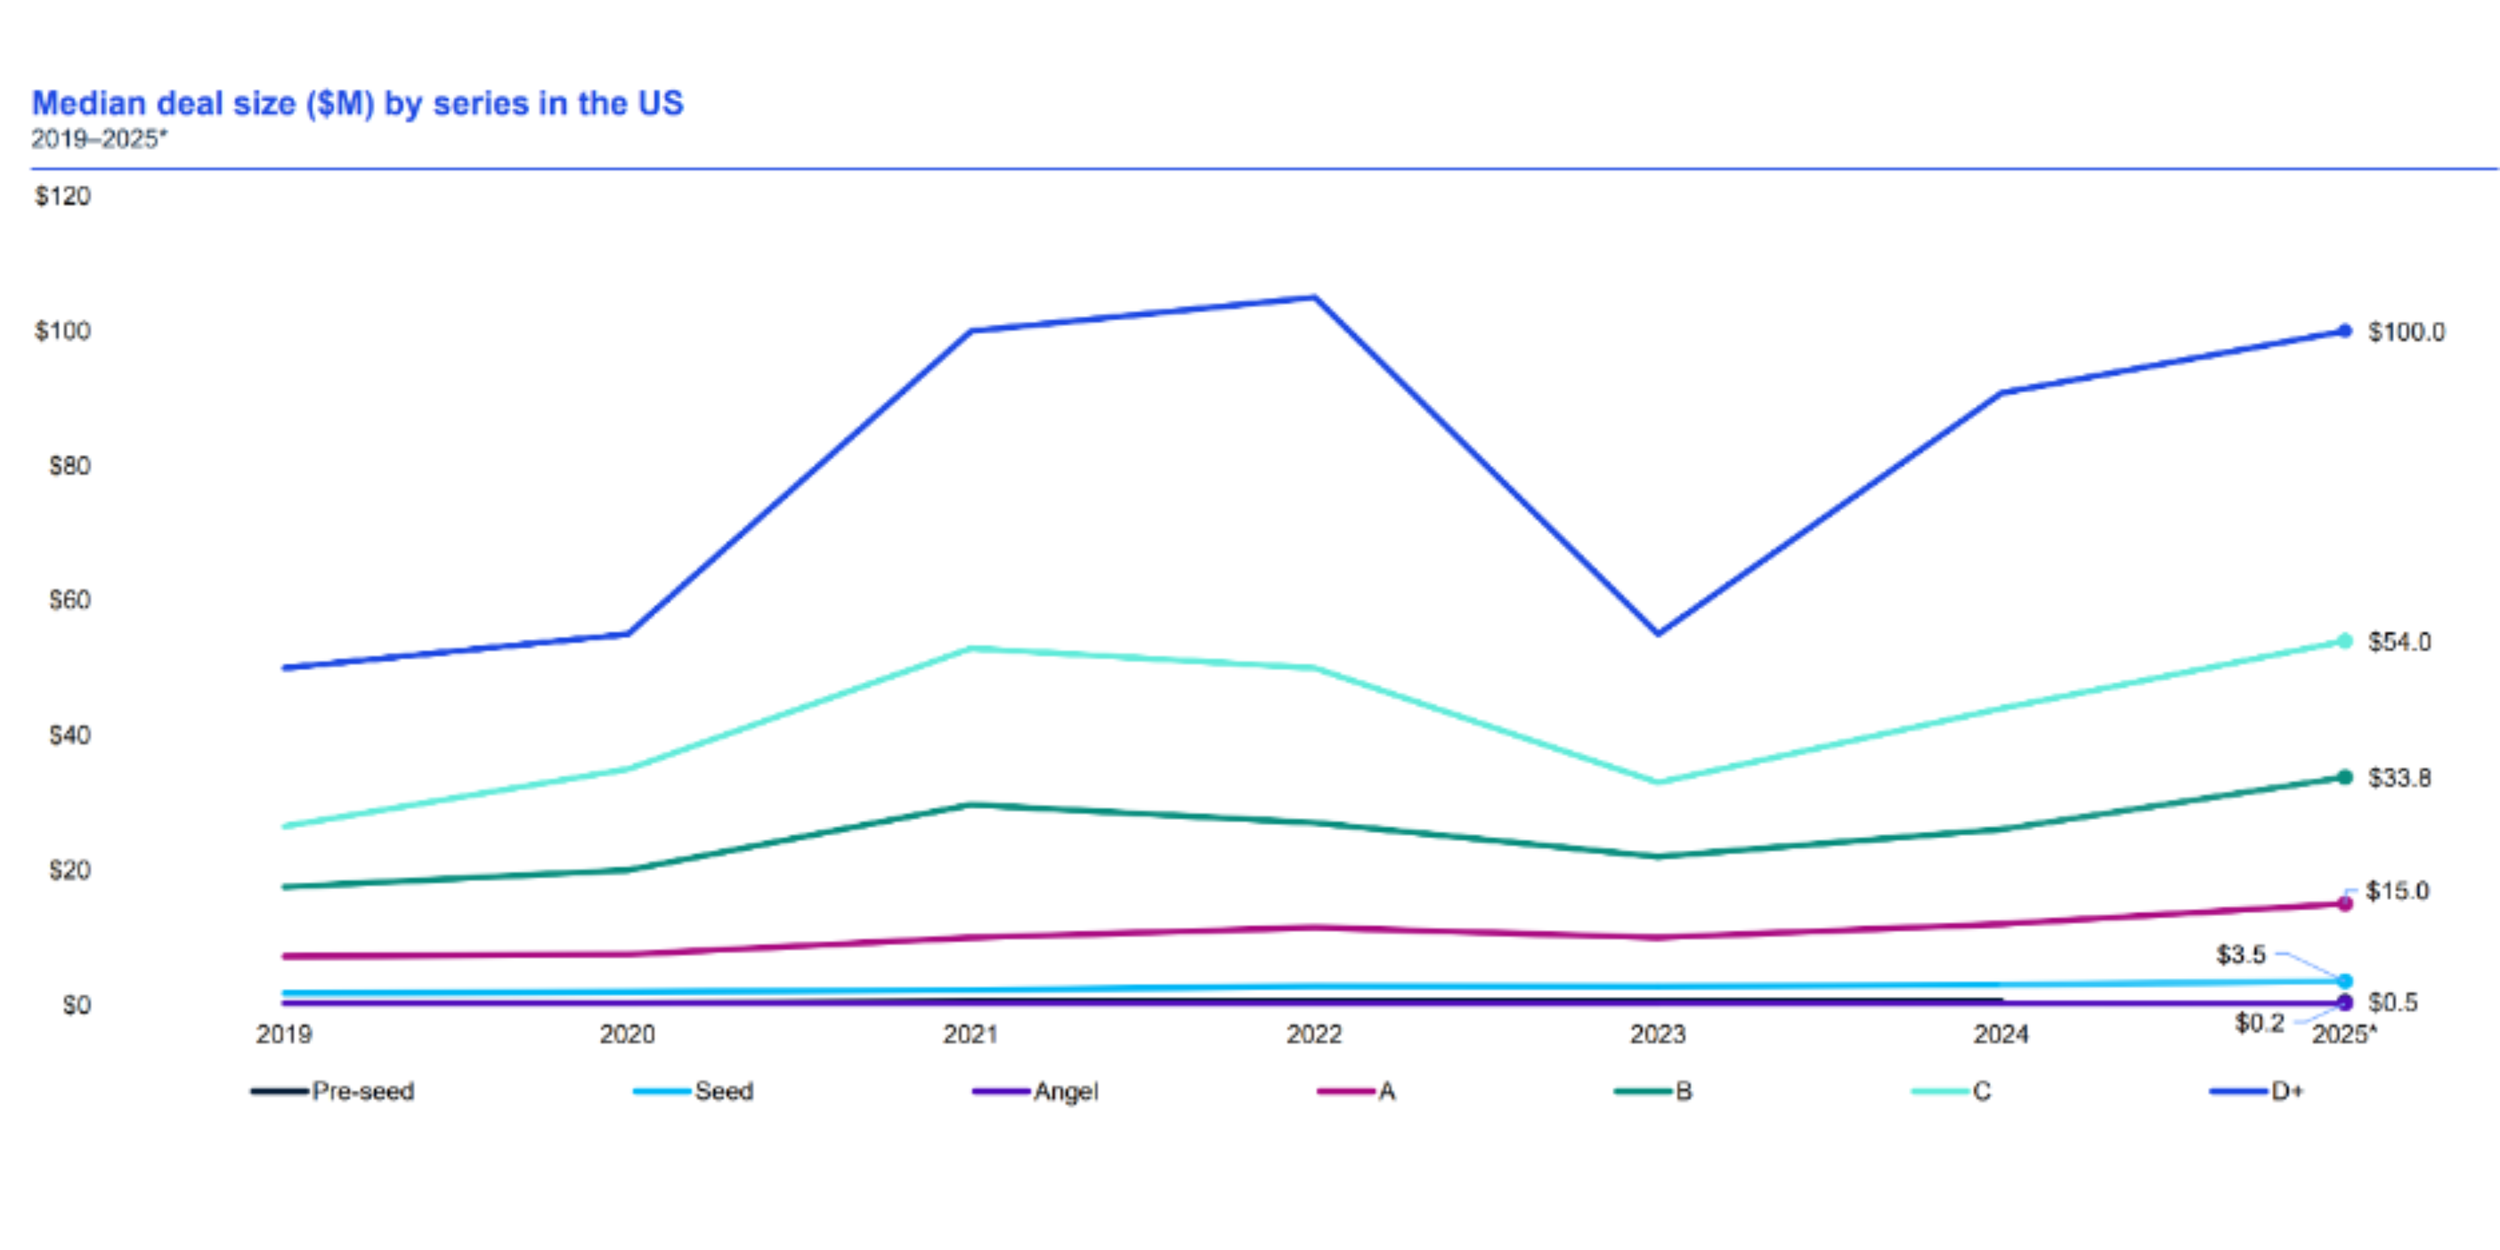
Valuation and median round data further demonstrate this polarization. Seed rounds reached a median deal size of US$3.8 million and a median pre-money valuation of US$15.5 million. Pre-seed medians remained comparatively flat, suggesting limited expansion at the very earliest stage. At later stages, median metrics expanded. Series B rounds reached a median deal size of US$33.8 million with median valuations of US$145 million. Series D+ rounds climbed to a median deal size of US$100 million and median valuations of US$856.5 million. The upward pressure at later stages reflects a flight toward companies perceived as scaled and durable in a prolonged liquidity-constrained environment.
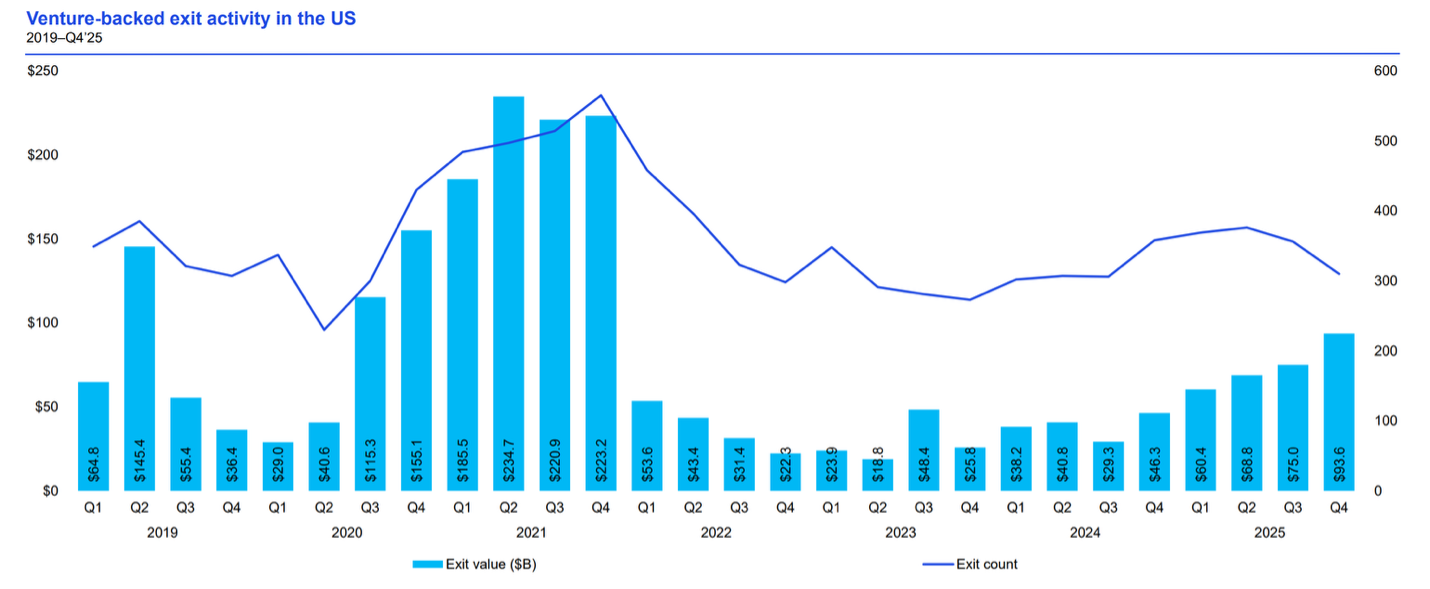
Exit activity provided partial support to overall sentiment. NVCA reports US$119.4 billion in exit value from 62 IPOs and an additional US$112.7 billion across 995 acquisitions in 2025. This marks a meaningful improvement compared with the 2022–2024 period, during which IPO markets were largely closed, though liquidity remains episodic and selective. Public markets rewarded profitability and durable cash flows, reinforcing the shift away from “growth at any cost.”
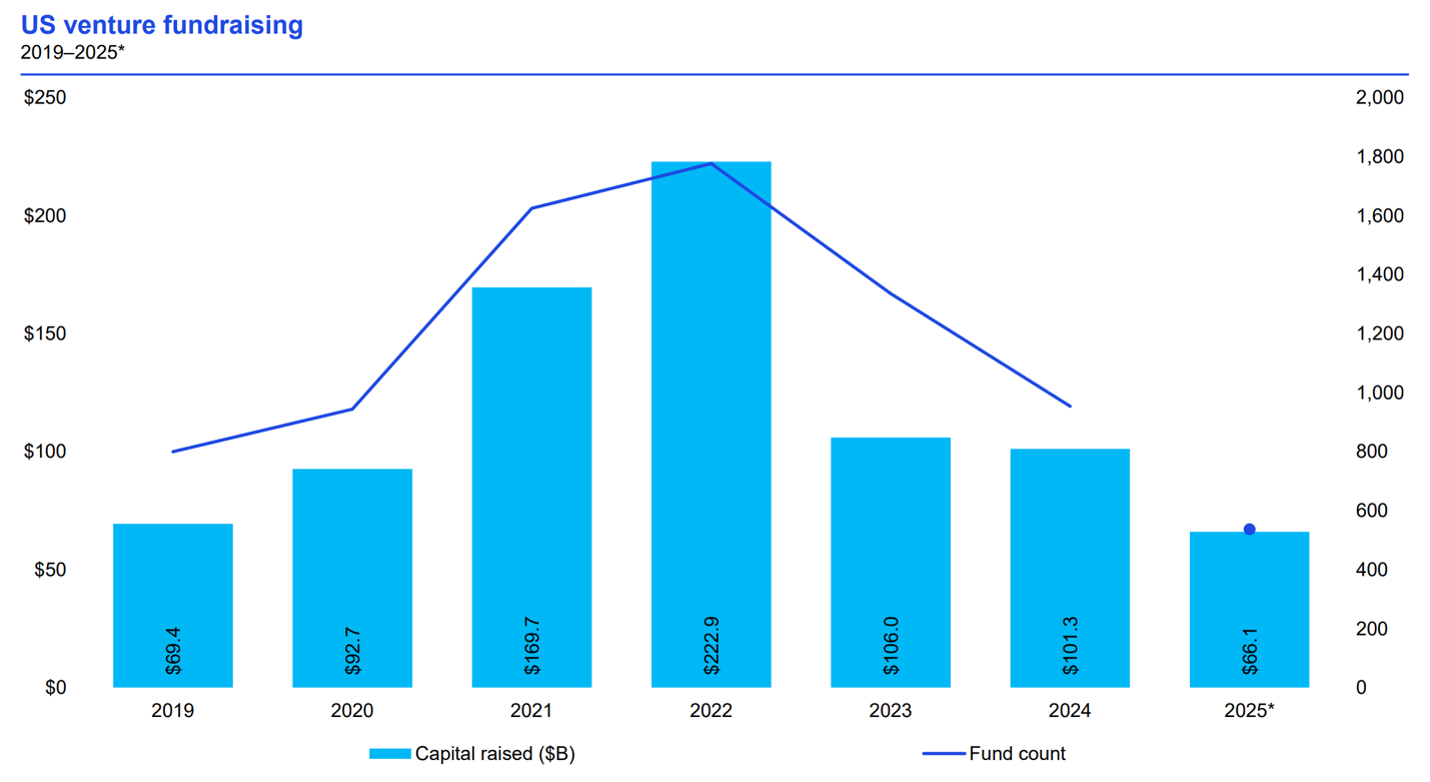
VC fundraising remains the primary systemic constraint. U.S. venture firms raised US$66.1 billion in 2025, the lowest annual total since 2017. This compares to US$101.3 billion in 2024 and nearly US$223 billion in 2022. The divergence between high deployment at the top-end and contraction in new fund formation tightens capital access for emerging managers and non-category-defining companies. Fewer funds with fresh capital leads to longer fundraising cycles, more insider-led follow-on rounds, bridge financings that avoid price resets, and delayed price discovery. While aggregate deployment appears strong, the effective supply of new risk capital remains limited.
Geographic concentration intensified alongside thematic concentration. Between 2022 and 2025, the West Coast’s share of total U.S. VC deal value increased from 48.6% to 64.5%. The San Francisco–San Jose–Oakland region alone accounted for 52.4% of all U.S. venture dollars in 2025. In contrast, Los Angeles’ share fell to 5.2%, its lowest in a decade. Five of the ten largest venture deals in 2025 were Bay Area-based AI companies. The combination of AI concentration, proximity to major research institutions, and renewed corporate emphasis on in-person collaboration has reinforced regional clustering effects. Capital and talent flows are increasingly reinforcing the same geographic nodes.
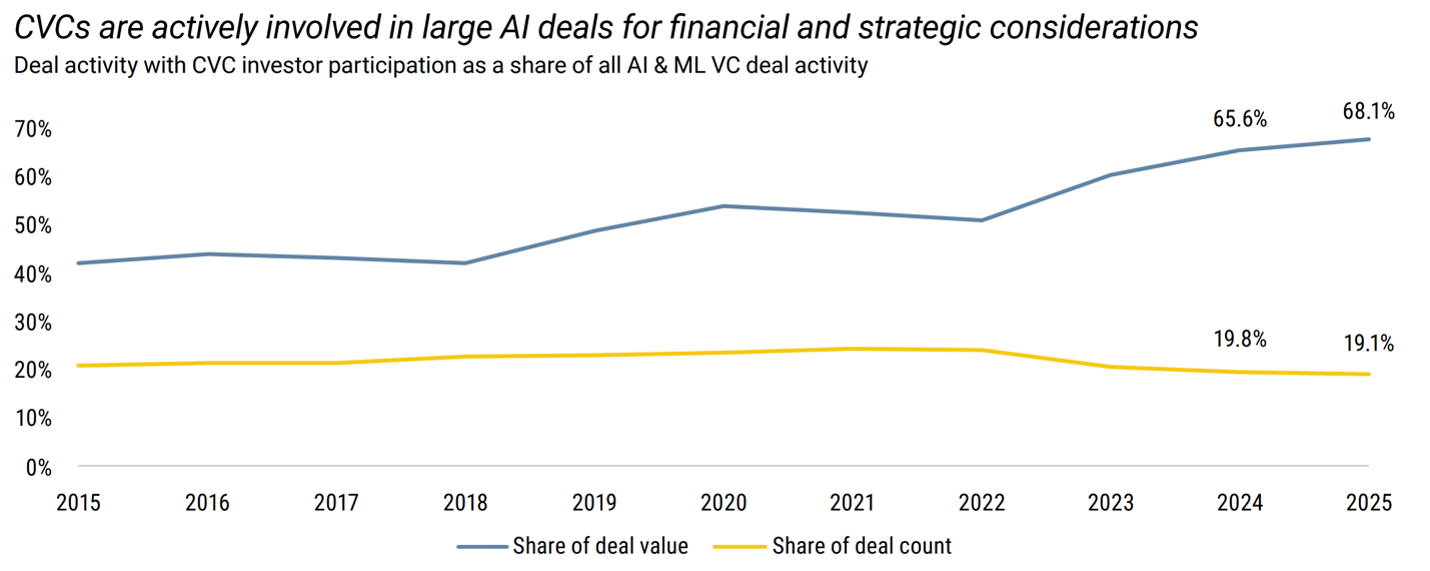
Nontraditional investor participation in 2025 shifted toward a strategy of massive scale over broad market exposure. Corporate venture capital (CVC) reached a staggering ten-year record of US$196.7 billion, yet this capital was concentrated into a significantly smaller pool of deals compared to 2021. Large corporates increasingly treated these venture rounds as outsourced R&D, funneling capital into massive AI-related financings to secure strategic positioning.
The depth of this concentration is most evident in the AI & ML sector, where CVCs participated in 68.1% of all deal value, despite being involved in only 19.1% of the total deal count. This extreme imbalance highlights a "winner-take-all" deployment of capital. Crucially, this trend mirrors the blatant round-tripping or “circular financing” – where companies invest in startups that then use that same capital to purchase the investor’s products – that served as a serious red flag marking the peak of the dot-com bubble. By recycling capital to inflate top-line revenue through venture "investments," the current cycle risks replicating the artificial growth patterns that preceded previous market corrections.
Meanwhile, other nontraditional players remained defensive. Crossover investors, such as hedge funds and asset managers, completed their fewest deals since 2020 due to a stagnant IPO market. Private equity firms limited their participation to 11.9% of VC deals, pivoting almost exclusively toward secondary opportunities where they could acquire mature assets at steep discounts to their peak-cycle valuations.
Taken together, the U.S. venture landscape in Q4 2025 reflects a market that has regained dollar momentum but not breadth. Capital is abundant for a relatively small set of AI-driven companies and later-stage assets perceived as defensible. Outside that cohort, fundraising timelines remain extended, valuation resets remain common, and access to new capital remains selective. The venture cycle has shifted from generalized risk expansion to concentrated capital allocation around infrastructure and scale.
Global Venture Capital Landscape
Global venture capital closed 2025 with strong aggregate investment levels, but the same structural pattern seen in the U.S. was visible internationally: larger checks, fewer companies funded, and AI as the dominant allocation driver.
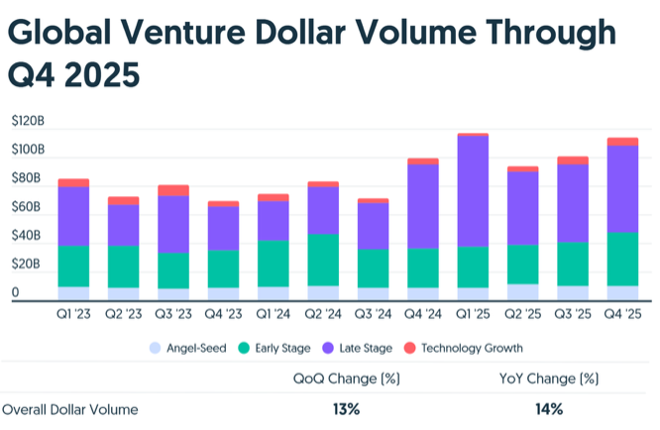
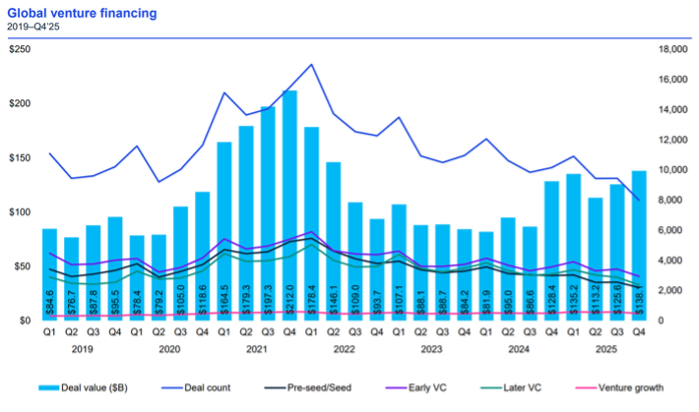
Global venture funding in Q4 2025 exceeded US$113 billion, representing a 14% YoY increase and a 13% QoQ increase. Much of that strength came from late-stage activity, with Q4 late-stage funding totaling US$66.5 billion, alongside an early-stage rebound to $37 billion. KPMG places Q4 global VC investment higher, at US$138.1 billion across 7,981 deals, the highest quarterly investment level in 14 quarters. The methodological differences between trackers are less important than the directional consistency: global venture dollars accelerated in Q4, while deal activity did not expand proportionally.
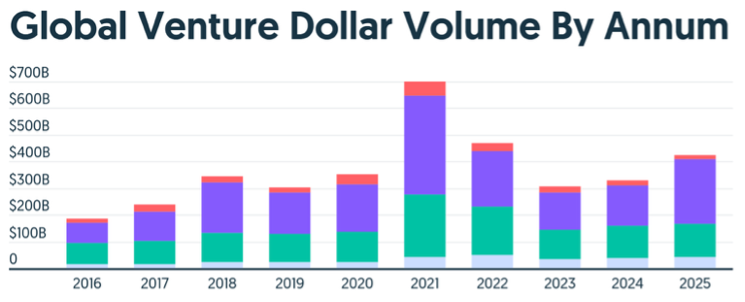
For the full year, global venture capital investment rose from US$391.9 billion in 2024 to more than US$500 billion in 2025, leaving the market materially recovered in dollar terms but still roughly 30% below the historic peaks of 2021 and 2022. More than 24,000 private companies received funding globally. Global venture capital recovered materially in dollar terms, even as deal volume remained well below prior-cycle highs.
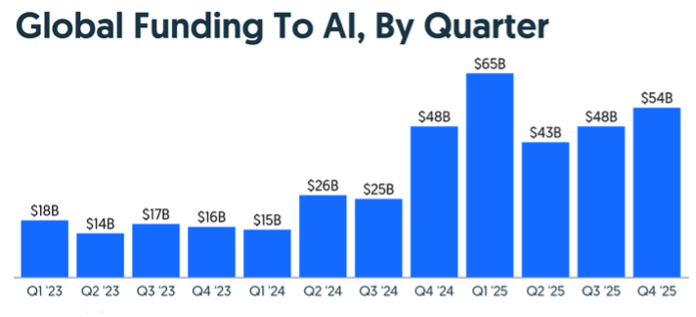
AI is also the central driver of this concentration. AI-related startups captured approximately US$202- US$211 billion in 2025, roughly 50% of total global venture funding, representing an 85% YoY increase and surpassing the prior global AI funding peak from 2021. Earlier in the year, Q3 global funding totaled approximately US$97 billion, with roughly US$45 billion, or 46%, allocated to AI. One company, Anthropic, accounted for approximately 29% of global capital in that quarter alone. Q4 did not dilute that pattern. It confirmed it.
The “big gets bigger” dynamic intensified. Sixteen companies globally accounted for nearly one-third of all venture capital raised in 2025. Importantly, the allocation has shifted beyond pure software narratives. A growing share of capital is flowing into infrastructure layers: compute, data centers, specialized chips, and energy capacity. Transactions such as Project Prometheus’ US$6.2 billion raise and Crusoe’s US$1.4 billion round to build modular renewable-powered data centers signal a pivot toward physical defensibility. The AI cycle is increasingly about who controls power purchase agreements, hardware supply chains, and manufacturing throughput, and less about whose model benchmarks highest this month. Defense technology also benefited from this shift, reaching US$49.1 billion in deal value in 2025, nearly double 2024 levels. Dual-use technologies have become a bridge between venture capital and national security priorities. We are seeing capital align with geopolitical durability.
Regionally, North America remained dominant, accounting for ~70% of global venture funding in 2025, driven largely by U.S.-based AI mega-rounds. Europe experienced a more complicated year. Aggregate deal value remained stable but fundraising for new European VC managers also hit record lows, raising questions about capital formation sustainability heading into 2026. Germany surpassed the United Kingdom as Europe’s top VC destination for the first time in over a decade, supported by large infrastructure and defense financings such as Helsing’s US$694 million round. France-based Brevo raised US$578 million in Q4, and Germany’s Black Forest Labs secured US$300 million, highlighting that while Europe continues to produce competitive AI and deep tech companies, the absolute scale of capital remains significantly smaller than in the U.S.
Asia remained comparatively subdued. No billion-dollar rounds were recorded in parts of the latter half of the year in key Asian markets, and China’s venture ecosystem continued to operate under domestic economic headwinds and U.S. investment restrictions. India’s deal value declined relative to its 2021 highs, and Southeast Asia increasingly shifted toward private credit and infrastructure themes rather than speculative growth. Latin America remained a small contributor to global totals, representing approximately 1% of global venture value, although Mexico surpassed Brazil in venture dollars for the first time since 2012.
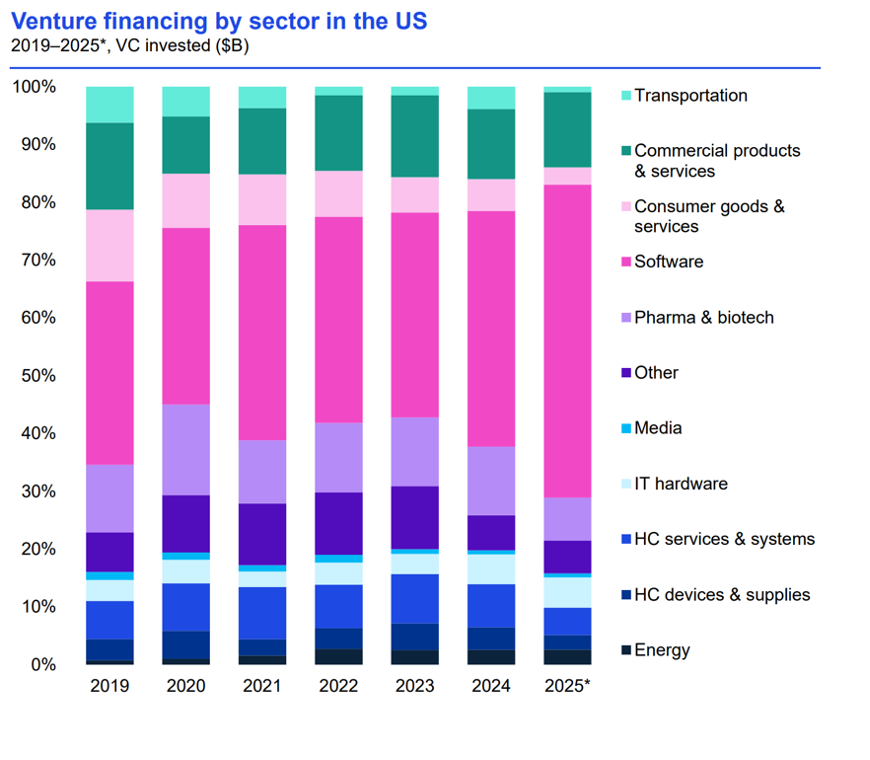
Sector allocation also demonstrates the narrowing of global venture breadth. AI’s share of global funding exceeded 50%, while fintech and biotech maintained steady but comparatively diminished shares of total capital. Horizontal AI platforms initially absorbed significant capital but by Q4, there was evidence of rotation toward vertical AI applications delivering specific return-on-investment use cases. Investors showed increasing preference for businesses with defensible infrastructure, data control, or hardware integration rather than lightweight software wrappers.
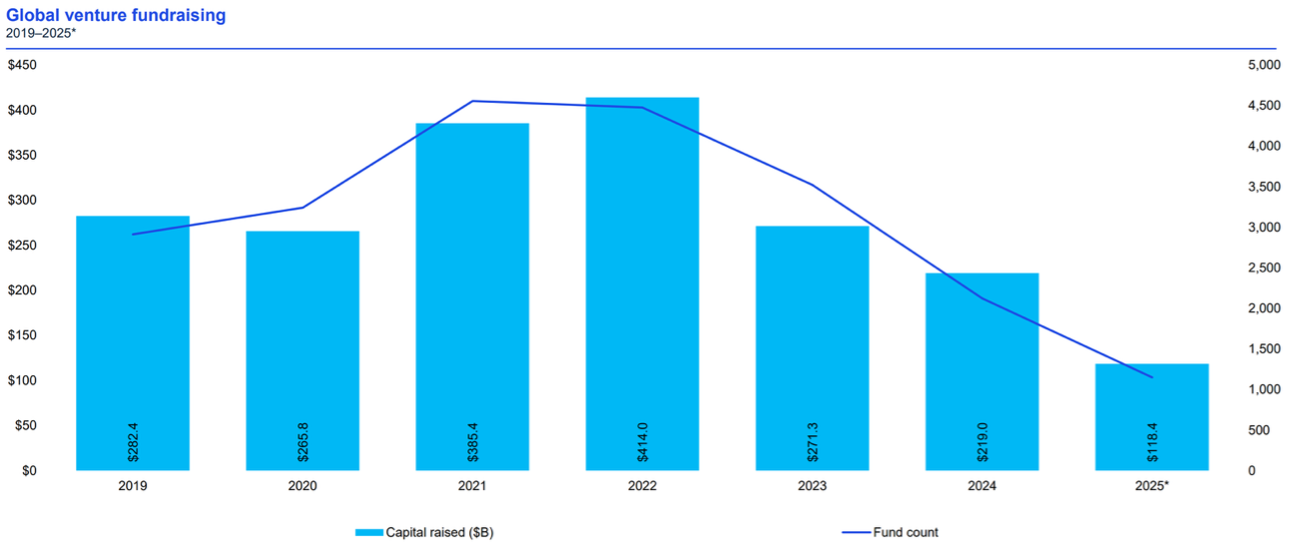
Global VC fundraising also lagged deployment: PitchBook reports that fundraising totaled US$118.6 billion in 2025, the lowest annual level in a decade. That divergence suggests that existing dry powder and incumbent managers drove much of the year’s capital allocation, while limited partners remained selective.
The exit environment improved but remained uneven. 2025 was characterized more by M&A strength than a broad IPO reopening. Corporates drove acquisition activity as they sought to acquire innovation rather than build internally. IPO markets showed improvement in the U.S., Hong Kong, and India; however, global IPO activity in Q4 was partially disrupted by the U.S. government shutdown, which delayed regulatory processing and compressed issuance windows. Political disruptions increasingly function as market microstructure variables, directly affecting liquidity timing and capital recycling.
Global venture capital in Q4 2025 reflects a market that has recovered in aggregate dollars but remains narrow in participation. AI and infrastructure dominate capital allocation, North America anchors global scale, fundraising lags deployment, and exit channels are improving but not fully normalized. The defining characteristic of the year is not broad-based exuberance but concentrated conviction around a single technological paradigm capable of lifting aggregate totals even as many adjacent sectors remain structurally constrained.
U.S. Digital Health Landscape
U.S. digital health ended 2025 on firmer footing than the sector has experienced in several years, though the recovery was uneven. Rather than a broad resurgence in venture activity, the year reflected a more selective market in which capital flowed disproportionately toward companies with clear distribution channels, defensible technology, and demonstrable operational impact.
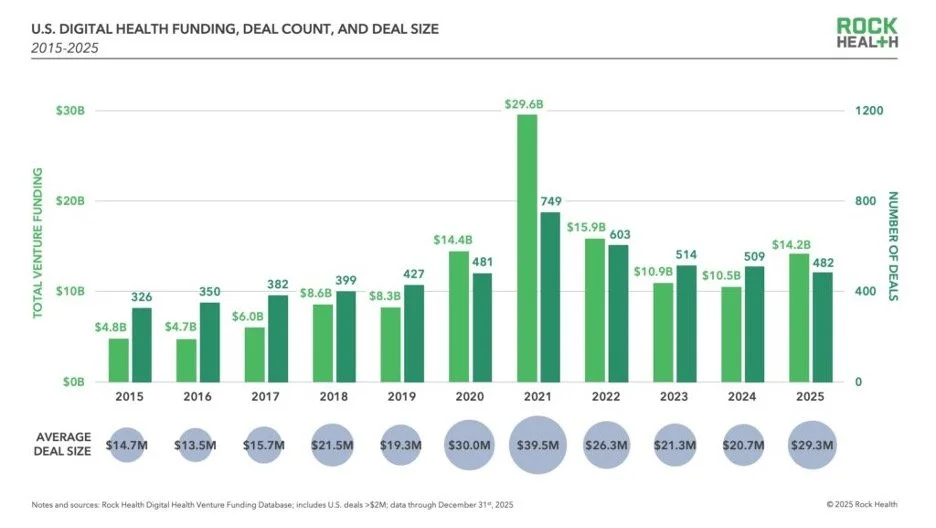
Rock Health reports that U.S. digital health startups raised US$14.2 billion across 482 deals in 2025, representing a 35% increase from US$10.5 billion in 2024. Despite this increase in total capital, overall deal activity declined modestly, with the number of financings falling 5% from 509 in 2024 to 482 in 2025. The combination of rising investment totals and fewer transactions points to a market increasingly shaped by larger rounds raised by a narrower set of companies.
Quarterly activity reflected this shift throughout the year. Q1 began with US$3.0 billion across 122 deals, followed by US$3.4 billion across 123 deals in Q2. Q3 saw US$3.5 billion deployed across 107 transactions, bringing year-to-date totals to nearlyUS$10 billion before the final quarter. The year concluded with US$4.2 billion across 129 deals in Q4, the strongest quarterly total since mid-2022 and a notable year-end acceleration in funding activity.
While funding volumes improved, the composition of investment tells a more nuanced story. The rise in aggregate dollars was largely driven by larger financing rounds rather than broader participation across the startup ecosystem. Average deal size increased to US$29.3 million in 2025, up from US$20.7 million the prior year, while the median round size increased modestly from US$10 million to US$12 million. This widening gap between average and median deal sizes underscores the influence of a relatively small number of outsized financings on overall market totals.
Large financings played an especially important role in shaping the year’s capital distribution. Rounds exceeding US$100 million accounted for approximately 42% of total digital health funding in 2025, the highest share observed since 2021. The concentration was pronounced enough that excluding the largest handful of financings would push total sector funding below 2024 levels. In practical terms, this suggests that the apparent recovery in funding was driven by a limited cohort of highly scaled or strategically positioned companies rather than a broad resurgence across the startup landscape.
Artificial intelligence continued to emerge as one of the most important drivers of investment within the sector. Companies integrating AI into clinical workflows, data infrastructure, and operational decision-making attracted a growing share of venture dollars. AI-enabled startups captured 54% of total digital health funding in 2025, up from 37% the previous year, and roughly half of all financings involved companies incorporating AI capabilities. Investors appear increasingly willing to support businesses that can demonstrate how machine learning can reduce administrative friction, enhance clinical decision support, or improve system-level efficiency.
The areas receiving the greatest investor attention were those directly tied to operational improvements within healthcare delivery. Startups building clinical and non-clinical workflow automation tools collectively captured nearly 39% of total sector funding. These companies are increasingly positioning themselves as infrastructure layers within provider systems—integrating documentation, coding, clinical decision support, and operational analytics into existing care environments. In a healthcare system facing persistent labor shortages and mounting cost pressures, solutions that increase productivity or reduce administrative burden have become particularly attractive investment targets.
Several notable financings during the year reflected this trend. Companies such as Ambience Healthcare, which raised a US$243 million Series B, and OpenEvidence, which secured US$210 million in Series B financing, exemplify the emerging category of AI-enabled operating platforms designed to augment clinical and administrative workflows.
Beyond provider infrastructure, consumer-oriented health technologies also experienced renewed investor interest. Fitness and wellness companies raised approximately US$2.0 billion across 44 deals in 2025, moving from the eighth-most funded category in 2024 to the third-largest by capital raised. While this shift was partly influenced by a US$900 million financing for Oura, the broader category also saw incremental growth in several adjacent segments, including biometric monitoring, preventative health diagnostics, and personalized health optimization.
Companies such as Function, Eight Sleep, Hims, Whoop, and Nourish expanded their offerings across diagnostics, data tracking, and subscription-based health services. The continued maturation of these companies suggests that consumer-focused health platforms may be evolving from pandemic-era outliers into more durable digital health infrastructure, particularly when paired with recurring revenue models and data-driven personalization.
Despite the improvements in capital deployment, the broader operating environment for digital health startups remains challenging. A meaningful share of financings during 2025 occurred through unlabeled rounds, which do not correspond to traditional venture stage designations. These financings often reflect companies extending runway while navigating valuation resets or working toward clearer growth milestones before raising a priced round. At the same time, elevated acquisition activity—including several distressed transactions—indicates that parts of the sector continue to grapple with the valuation overhangs created during the peak funding years of 2020 and 2021.
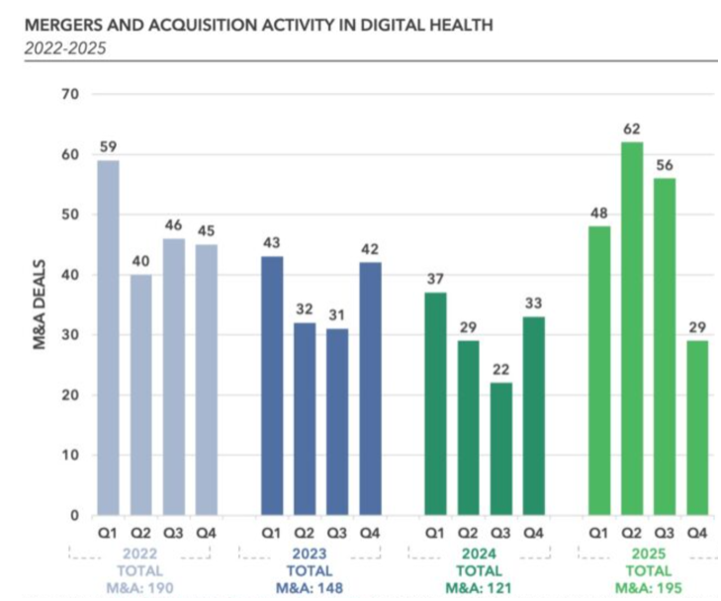
Exit activity improved meaningfully after a multi-year drought. Five public listings occurred in 2025: Hinge Health, Omada Health, Heartflow, Carlsmed, and Profusa. While some priced below prior private valuations – Hinge Health debuted at a US$2.3 billion market capitalization compared to a US$6.2 billion private peak – public market demand proved constructive, with several companies trading up following their listings. Public markets therefore showed tentative signs of reopening, though IPO activity remained far below the levels seen during the 2020–2021 cycle. M&A activity increased 61% year-over-year to 195 transactions, reflecting a meaningful recovery in acquisition activity. Digital health companies themselves accounted for 66% of acquisitions, underscoring that consolidation is increasingly occurring within the sector as scaled platforms pursue roll-up strategies, acquiring adjacent capabilities to expand product breadth, consolidate fragmented solution categories, and accelerate distribution across provider and payer markets. Private equity participation in health technology also increased significantly, targeting companies demonstrating “Rule of 40” performance profiles and double-digit EBITDA margins suitable for platform consolidation strategies. Despite improving liquidity pathways, the exit market remains selective, with strategic buyers prioritizing companies that deliver clear operational value or differentiated technology, particularly in areas such as AI-enabled infrastructure, workflow automation, and healthcare data platforms.
Taken together, the digital health market entering 2026 appears healthier but more selective than in previous cycles. Capital is available, but it is increasingly directed toward companies demonstrating measurable impact on healthcare delivery, strong distribution partnerships, and defensible technical differentiation. For emerging startups, this environment places greater emphasis on operational discipline and product-market fit, while for more mature companies it reinforces the importance of scale, integration, and sustainable revenue models.
Canadian VC Landscape
The Canadian venture market in 2025 reflected resilience, but the kind supported by a relatively small number of exceptionally large financings. Headline investment totals held up better than many expected, yet beneath the surface the structure remains defined by a narrowing early-stage funnel, outsized reliance on mega-deals, and the same unresolved exit and fundraising constraints that have lingered for several cycles now.
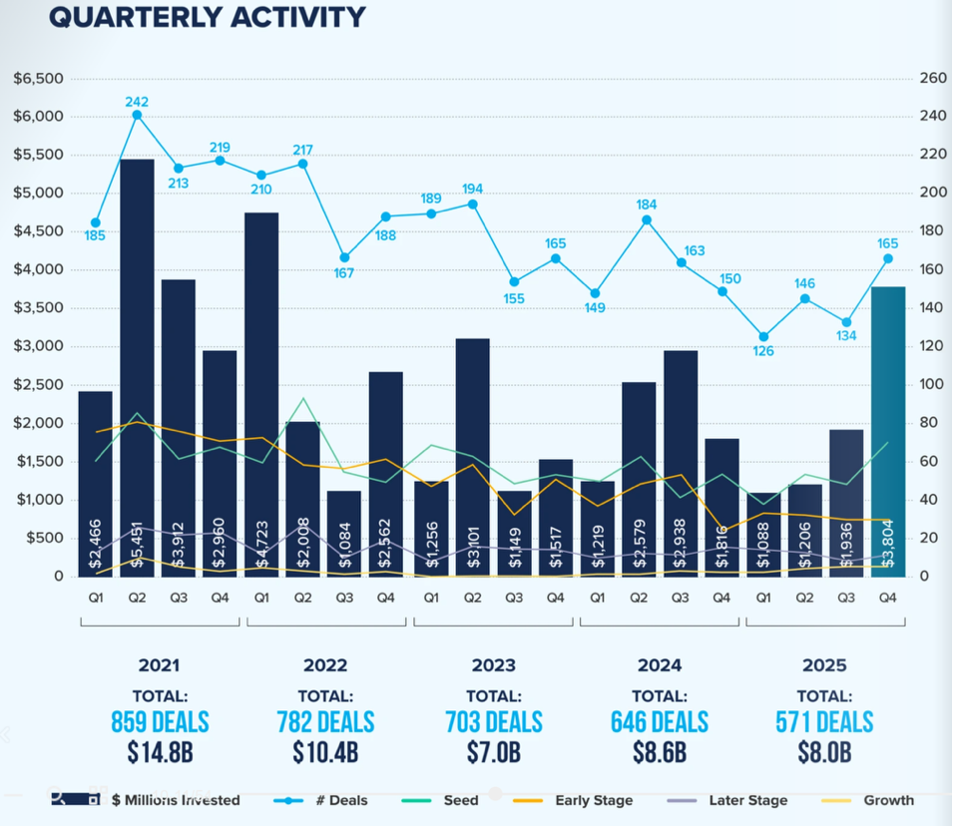
Through the first nine months of the year, CVCA reported $4.9 billion invested across 386 deals, including $1.8 billion across 123 deals in Q3. Deal activity was down approximately 27% from the five-year average. Capital totals remained within the mid-single-digit billions, which looks stable on a chart, but the shrinking deal count told a familiar story: fewer companies were accessing capital, even as aggregate dollars held up.
Q4 altered the annual profile materially. Full-year 2025 closed with $8.0 billion invested across 571 deals, only 6% below 2024 in total capital despite a 12% drop in deal count. Average disclosed deal size increased 6% YoY to CAD $14.07 million, not because checks were universally larger, but because capital clustered more tightly at the top. Including $1.3 billion in secondary transactions, total venture investment reached $9.3 billion across primary and secondary activity. Secondary liquidity is increasingly embedded within the ecosystem rather than functioning as a marginal tool, reflecting the continued absence of robust IPO exits.
The fourth quarter did most of the heavy lifting. Q4 alone recorded 165 deals raising just over $3.8 billion, accounting for 47% of total 2025 capital and nearly doubling Q3 levels. The surge was anchored by a small number of large financings. Ten mega-deals accounted for $3.2 billion in Q4, compared with $1.4 billion across ten mega-deals in Q3. Across the full year, 26 mega-deals (>$50 million) raised $5.3 billion and represented 66% of total VC investment. Q4’s average disclosed deal size reached $23.06 million, the highest quarterly average on record. The year-end spike made the annual curve look healthier, but it was powered by a small number of very large engines.
A few flagship transactions amplified this effect. Toronto-based Waabi announced a US$750 million-$1 billion Series C round tied to a commercialization partnership with Uber, the largest Series C in Canadian tech history. Cohere raised US$500 million at a US$6.8 billion valuation, reinforcing enterprise AI as one of the few categories capable of consistently attracting global late-stage capital. CoLab Software secured a US$101 million Series C out of Newfoundland and Labrador, driving Atlantic Canada’s average deal size to a record $27.21 million. These rounds lift national totals but they do not widen the base of early-stage activity.
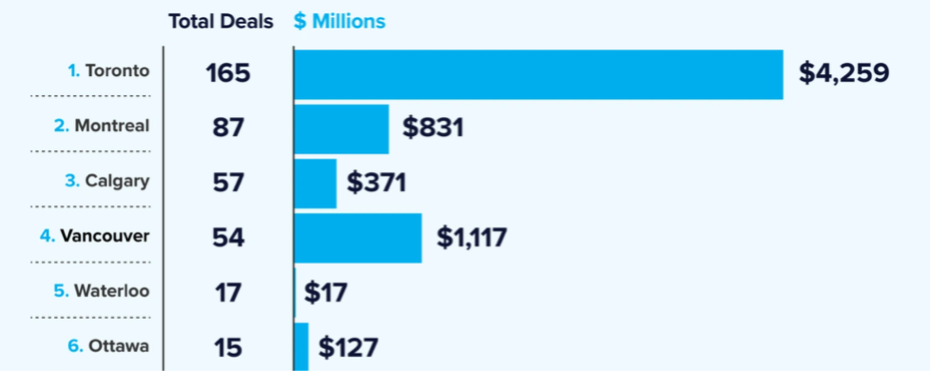
Geographic concentration persisted. Ontario led with $4.6 billion across 247 deals, followed by British Columbia with $1.4 billion across 70 deals and Québec with $1.0 billion across 122 deals. Together, these three provinces accounted for approximately 84% of total dollars deployed. While Manitoba, Nova Scotia, and Atlantic Canada posted record annual figures in select cases, scaling capital and late-stage syndication continue to cluster within the Toronto-Montreal-Vancouver corridor. Canada’s venture geography remains highly efficient, and highly centralised.
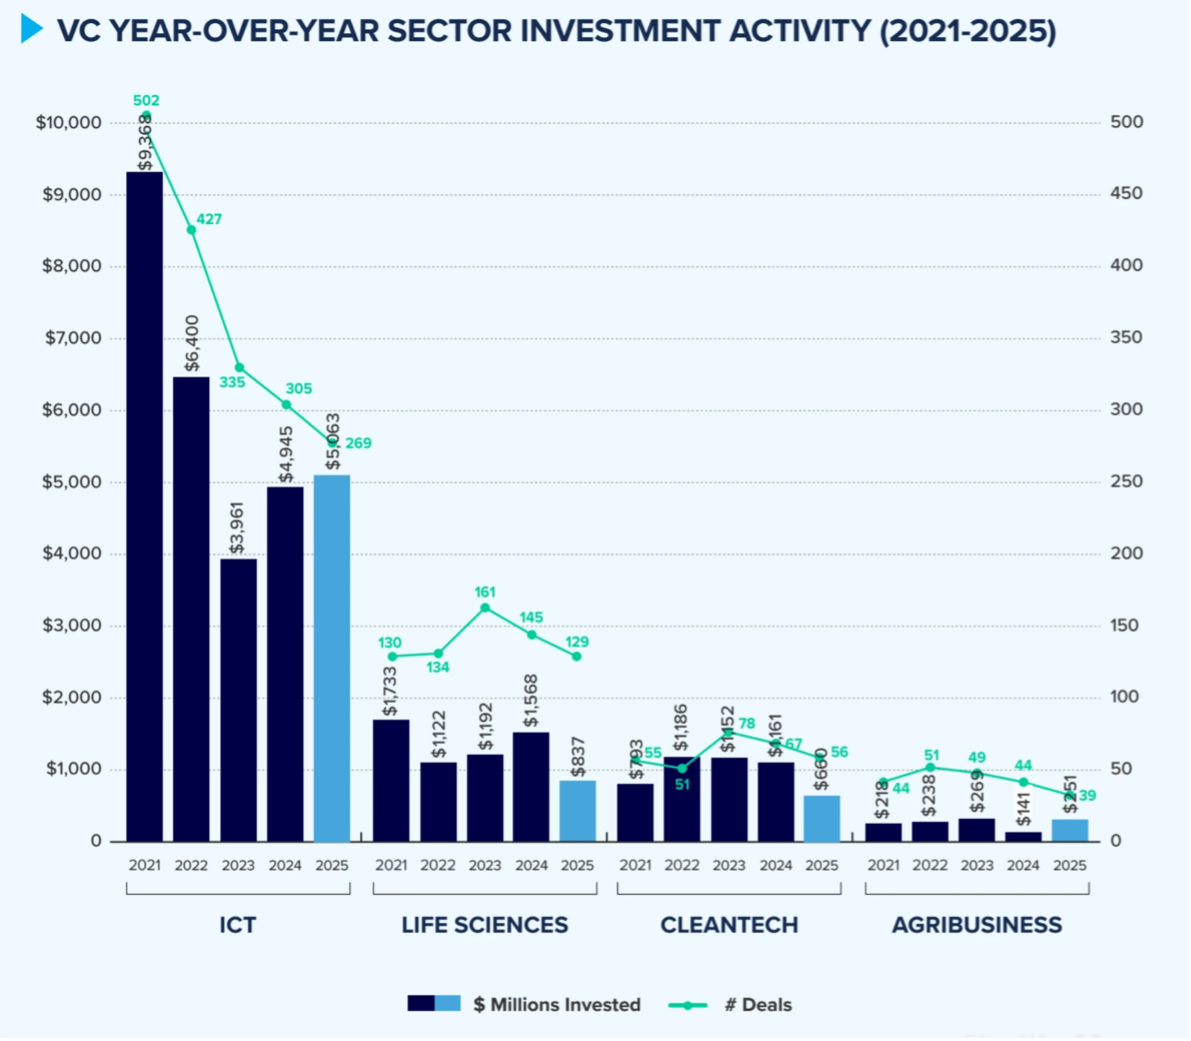
Sector allocation tells a similar story. Information and Communications Technology (ICT) attracted 64% of total capital in 2025, reaching $5.1 billion across 269 deals. Dollars invested increased 2% YoY while deal count declined 12%, demonstrating a “fewer but larger” pattern. Life Sciences experienced a 47% YoY decline to $837 million, its lowest level since 2018. Agribusiness, by contrast, recorded $251 million across 39 deals, including 4AG Robotics’ $40 million Series B, a reminder that automation linked to real-world industries continues to attract capital. Increasingly, healthcare-adjacent innovation is classified under ICT, particularly AI-enabled workflow and data platforms, which subtly expands its access to software-focused capital pools.
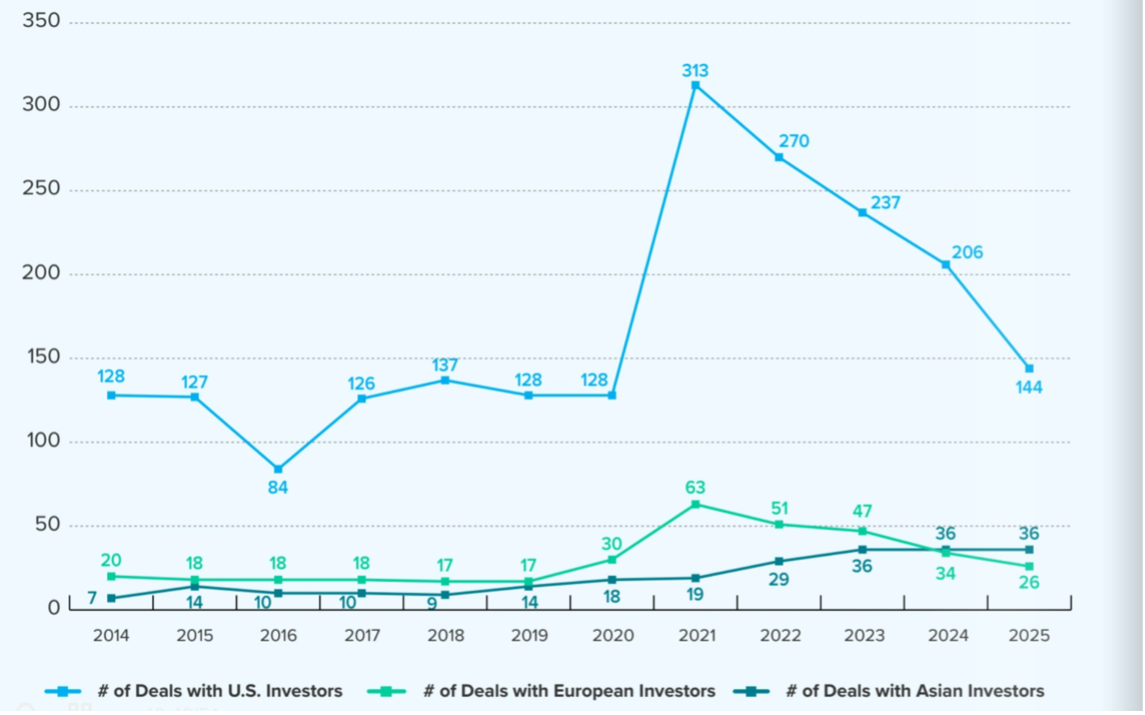
Foreign participation moderated. U.S. investor involvement in Canadian mega-deal rounds declined 13% YoY, with U.S. investors participating in roughly two-thirds of financings above $50 million, the lowest participation rate since 2016. Some datasets suggest overall U.S. participation across mega-deals has fallen closer to 25%, reflecting increased selectivity. Reduced foreign capital may support pricing discipline but it also reduces the depth of follow-on syndicates, placing greater pressure on Canadian companies to demonstrate capital efficiency or relocate financing centers to the U.S.
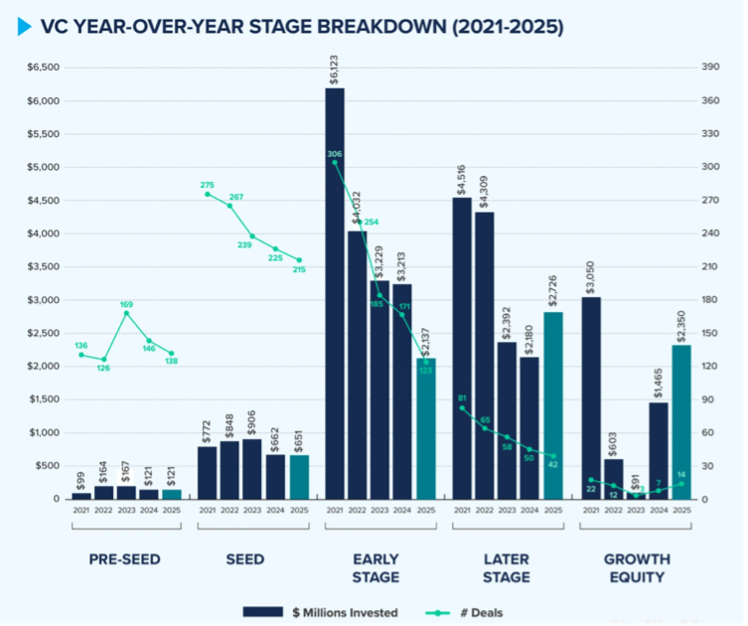
Stage dynamics further showed late-stage bias. Later-stage investment (Series C+) reached $2.7 billion across 42 deals, while growth-stage investment totaled $2.35 billion across 14 deals, with growth-stage deal count doubling and dollars invested rising 60% YoY. In contrast, pre-seed and seed experienced softer deal flow and smaller average check sizes. This narrowing of the early-stage funnel raises medium-term pipeline concerns, as capital is pulled forward into perceived winners rather than broadly distributed across emerging companies.
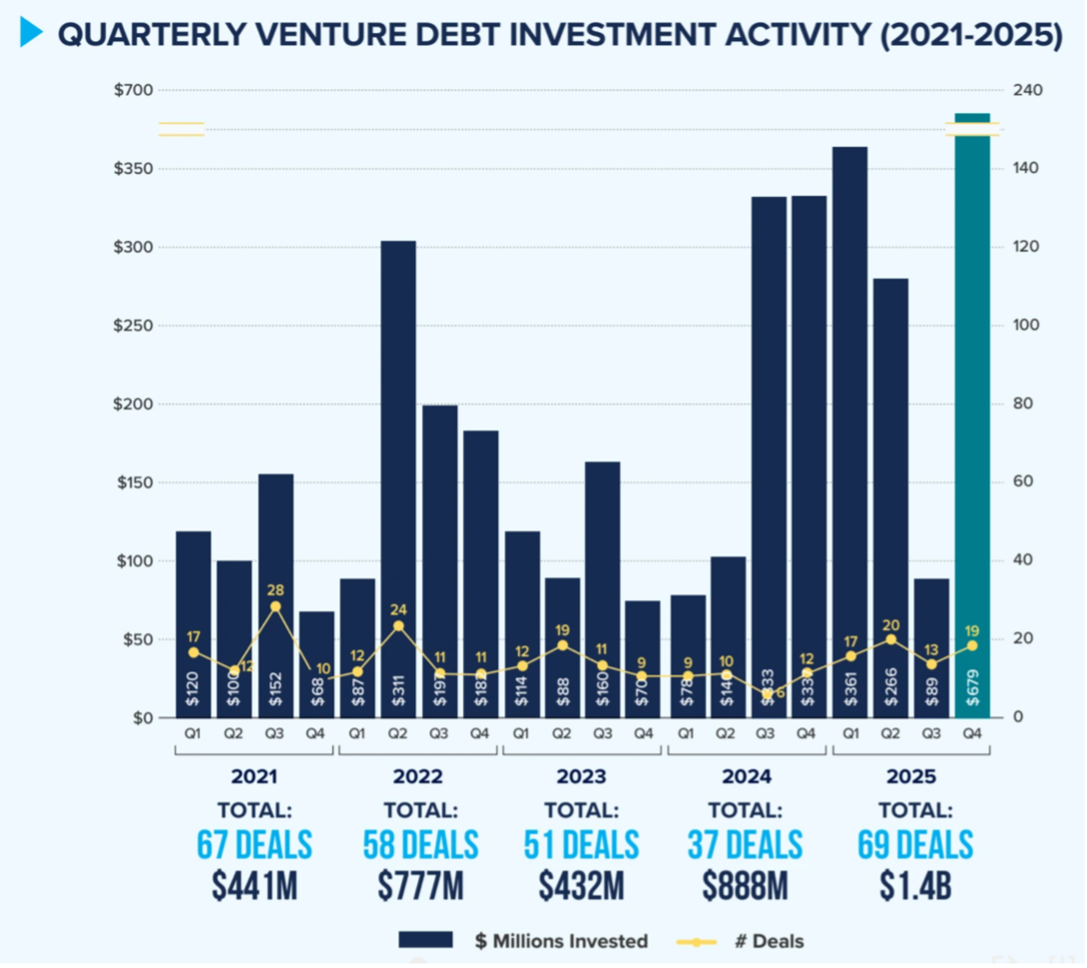
Venture debt emerged as a structural feature of the 2025 ecosystem. By end of September, venture debt totalled $717 million across 50 deals; however, by year-end, it reached $1.4 billion across 69 transactions, nearly half occurring in Q4. CIBC Innovation Banking alone participated in 38 rounds totaling $453 million. Founders increasingly used non-dilutive capital to extend runway while avoiding equity resets.
VC fundraising remains the clearest systemic bottleneck. Only 21 funds raised approximately $2.1 billion in 2025, the lowest total since 2016. The five largest funds captured 83% of capital raised, while emerging managers secured only $249 million, the lowest annual total in the dataset. The concentration of LP commitments constrains the domestic Series A/B pipeline and increases reliance on foreign investors at later stages.
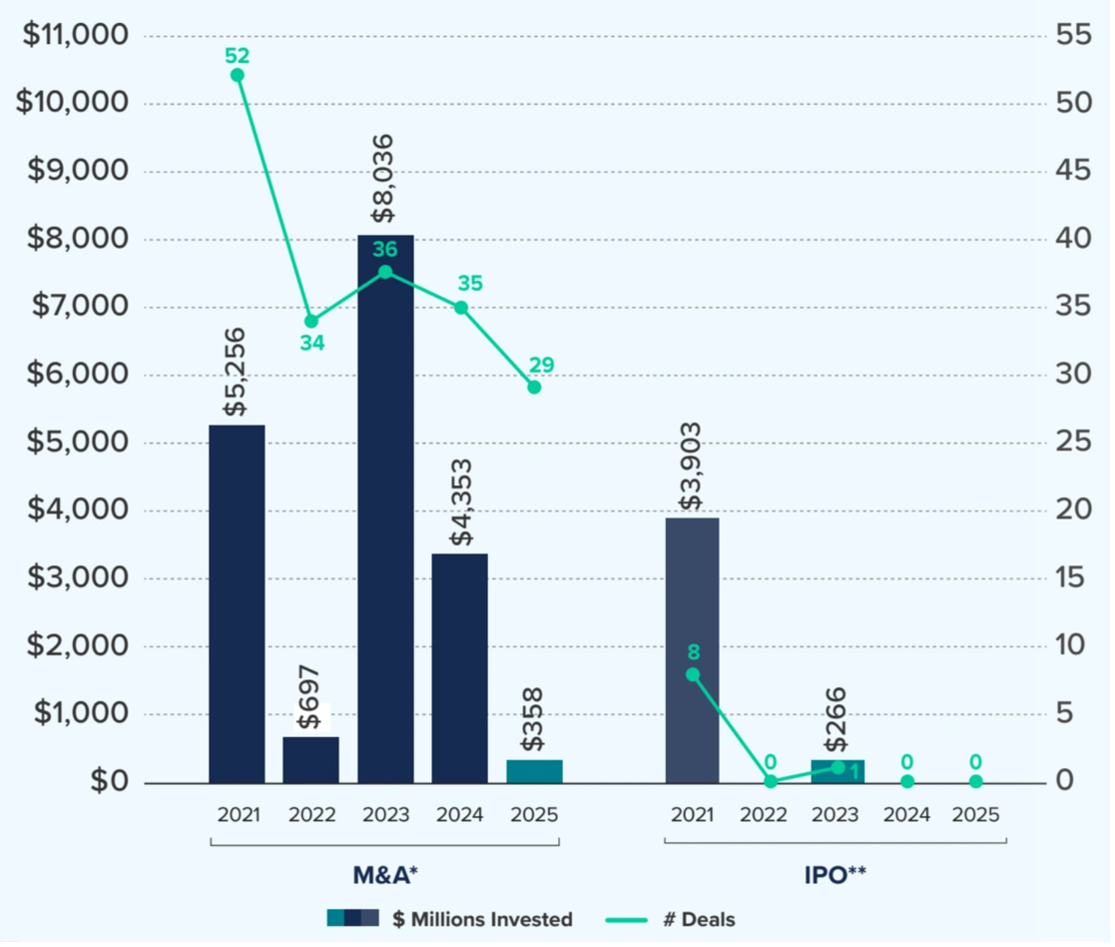
Exit activity remains the most persistent structural weakness. Canada recorded 29 exits totaling approximately $358 million in disclosed proceeds in 2025, all via M&A. The market has now gone multiple consecutive years without a traditional venture-backed IPO. Exit proceeds from acquisitions were down approximately 25% from 2021 peaks as valuations reset. The absence of IPO liquidity constrains capital recycling to limited partners, which in turn limits new fund formation and early-stage risk appetite.
Canada’s 2025 venture profile shows an ecosystem that can still produce globally competitive companies, particularly in AI and enterprise software, but one that remains narrow in participation and compressed in liquidity.
Capital Formation and Liquidity Cycle
Q4 extended the liquidity thaw that began in Q2 and became visible in Q3, but it also made something uncomfortably clear: exits are reopening faster than fundraising, and improving liquidity does not automatically translate into fresh capital formation. The system is moving again – just not evenly.
By Q3, venture exit value had reached $74.5 billion across 362 deals, the strongest quarterly liquidity event since the 2020-2021 cycle. YTD exit value had already surpassed the combined totals of 2022 through 2024, marking a genuine inflection point after several years in which the IPO window was effectively sealed shut and M&A felt largely defensive. The pressure relief valve reopened, cautiously.
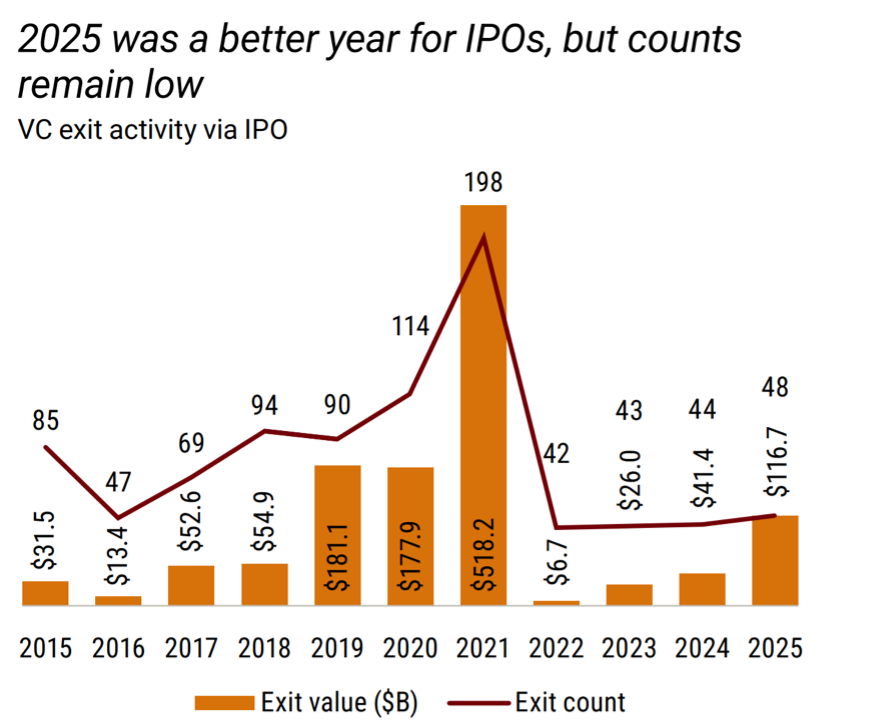
Full-year data confirm that shift. 2025 generated $119.4 billion in exit value from 62 IPOs and another $112.7 billion from 995 acquisitions. The mix matters. IPO activity returned but in fewer listings, higher quality screens, and stronger alignment with profitability or policy-favored sectors. M&A activity expanded as corporates sought to acquire innovation directly rather than build it internally, reinforcing strategic consolidation as the primary liquidity pathway. This is not a return to 2021 exuberance, but it represents a functional reopening of exit channels.
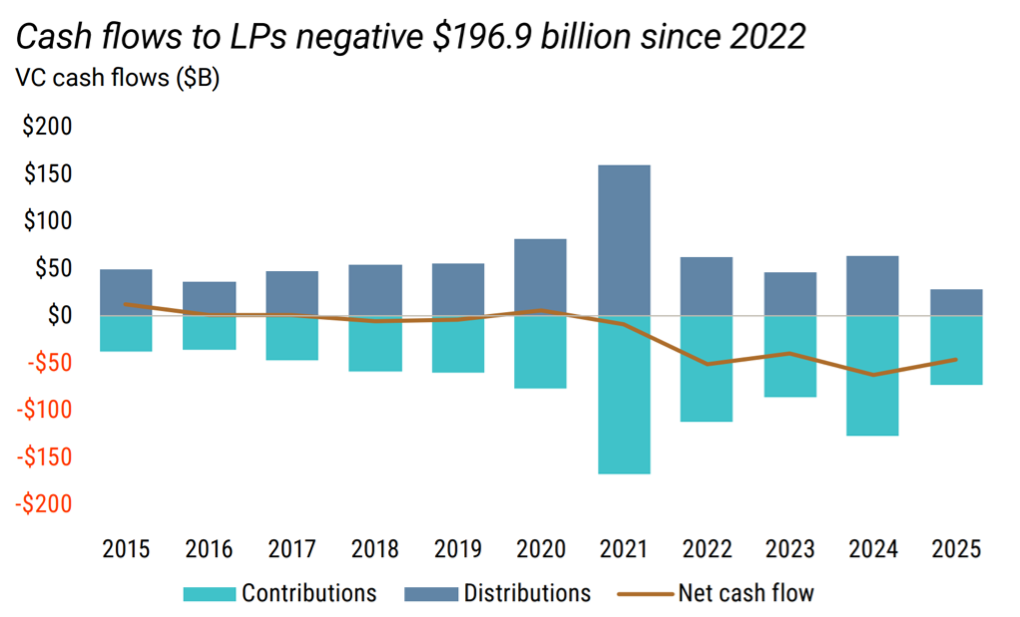
Yet liquidity reopening is not the same thing as liquidity recycling. Venture managers do not fully liquidate public holdings immediately post-IPO. Lockups, distribution pacing, and portfolio strategy decisions create inertia. Reopening the IPO window is a necessary condition for liquidity normalization, but it is not sufficient for rapid DPI acceleration. Net cash flows to LPs have remained negative for nearly four consecutive years, producing a persistent DPI deficit. In other words, there are exits, but not enough realized cash returning to LP balance sheets quickly enough to reset commitment appetite.
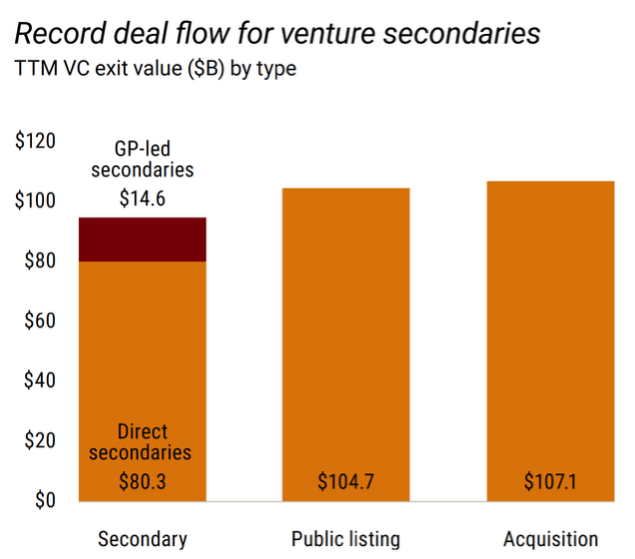
The secondary market has absorbed much of this pressure. U.S. direct secondaries are estimated at US$60-$65 billion annually, with broader secondary market volume approaching US$94.9 billion by Q3 2025. Fund units have become more actively traded than common stock. Continuation funds and GP-led processes are increasingly used to provide partial liquidity to LPs while retaining ownership of high-conviction assets. They provide partial liquidity, extend asset duration, and improve DPI optics. What they do not reliably do is generate immediate redeployment into new venture commitments. Liquidity is occurring, but not necessarily compounding.
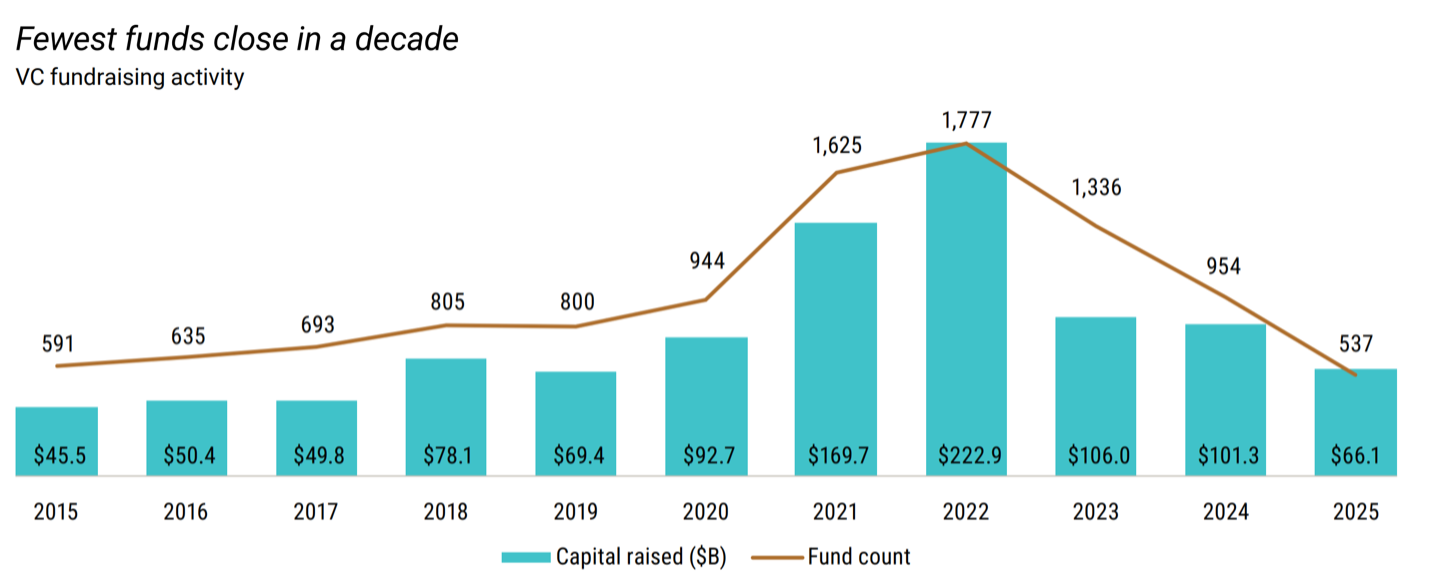
Fundraising reflects that constraint. U.S. venture fundraising totaled US$66.1 billion in 2025 across 537 funds closed, the lowest annual level since 2018 and approximately 60% below the 2021 peak. Through Q3, only US$45.7 billion had been raised across 376 funds. Median time to close a new fund extended to 15.6 months, up from 9.7 months three years prior. Only about 30% of managers that raised during the 2021-2022 cycle have successfully closed follow-on funds. Roughly 70% of newer managers have not, leaving a large cohort of stranded or reserve-only investors.
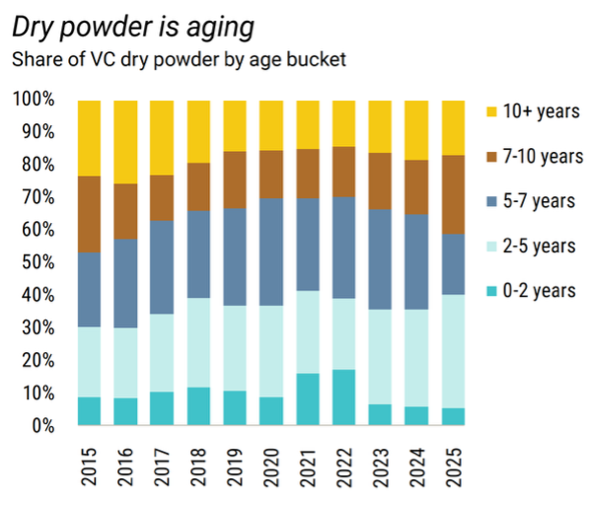
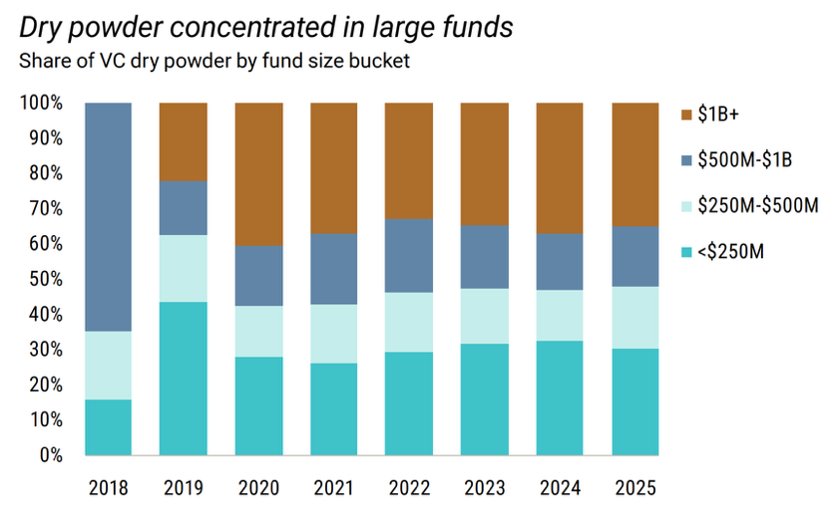
LP balance sheets help explain the drag. Approximately US$166 billion sits in funds between two and five years old, representing the highest proportion of aging capital since the post-dot-com period. These “unfunded commitments” create a denominator effect: LPs hesitate to allocate new capital while significant commitments to 2021 vintages remain uncalled or unrealized. As a result, fundraising is skewed toward established brands. Funds larger than US$500 million represented just 6.7% of closed funds over the last four years but now account for 52.3% of available dry powder. The asset class is consolidating around fewer, larger managers with demonstrated DPI potential.
Canada presents an even tighter formation environment. Canadian VC fundraising totaled approximately $2.1 billion in 2025, the lowest level since 2016, with the five largest funds capturing 83% of commitments. Emerging managers raised just $249 million, their weakest annual total in the dataset. Even as Canadian venture deployment rose on the back of mega-rounds, the domestic capital base that feeds early-stage pipelines contracted. Liquidity improvement at the global level does not automatically restore capital availability at Seed or Series A domestically.
Twelve-month VC distribution yields currently sit near 6.5% of NAV, well below the long-term average of approximately 17%. That gap helps explain why fundraising remains constrained even as exit activity improves. Liquidity has resumed in headline terms, but realized cash returns have not yet reached a level that resets LP allocation appetite. The lag between exit reopening and DPI normalization is shaping capital formation more than deployment velocity.
The market has transitioned from liquidity drought to selective liquidity, an environment where high-quality assets can clear, but weaker ones remain stranded. The system is stabilizing, though under tighter capital discipline, slower recycling cycles, and a more concentrated LP base than in prior expansions.
Looking Ahead
Looking ahead to 2026, the key shift is that uncertainty has moved from “are markets functioning?” to “how durable is the current regime?” The plumbing of capital markets is open again – for the moment. IPOs are occurring, M&A is active, credit spreads are contained, and rate policy is no longer restrictive in the way it was in 2023. The question now is whether the current equilibrium of moderate growth, easing bias, and AI-anchored capital spending can persist without broader participation.
What makes 2026 interesting is that, for the first time in several years, the binding constraint may be less liquidity than imagination. Capital is available, but it’s flowing along very well-worn channels: AI infrastructure, enterprise productivity, consolidation at scale. The real upside surprise would not be “more AI,” but a broadening of participation — new categories attracting capital, IPO markets deep enough to support mid-tier companies, or LPs regaining enough confidence to fund emerging managers again. The downside risk is not recession so much as stagnation: capital keeps recycling inside the same loop, funding bigger versions of the same bets.
If 2021 rewarded velocity and 2023 rewarded survival, 2026 may reward discipline above all else.